
FIGURE 6.
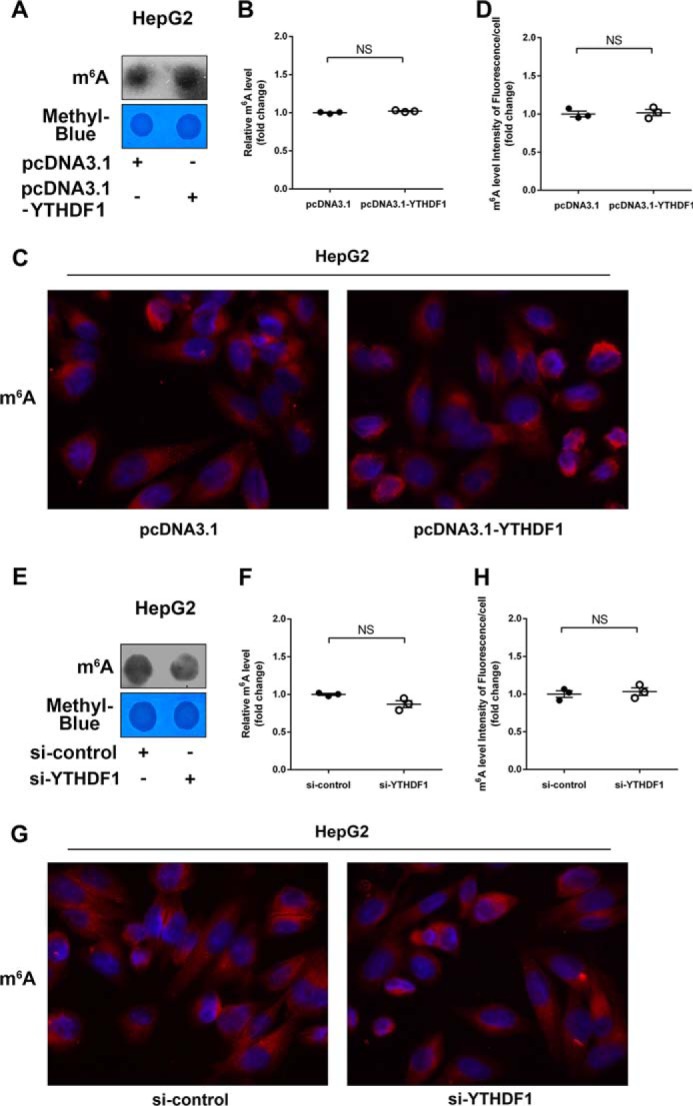
YTHDF1 had no effect on m6A levels of mRNAs. A, levels of m6A were measured by dot blot assays in HepG2 cells transfected with pcDNA3.1-YTHDF1. B, quantification of m6A in A. C, immunofluorescence images of m6A (red) are shown. DAPI staining (blue) was included to visualize the nucleus. D, quantification of the intensity of fluorescence per cell of m6A levels in C. E, levels of m6A were measured by dot blot assays in HepG2 cells transfected with si-YTHDF1. F, quantification of m6A in E. G, immunofluorescence images of m6A (red) are shown. DAPI staining (blue) was included to visualize the nucleus. H, quantification of the intensity of fluorescence per cell of m6A levels in G. NS, not significant.