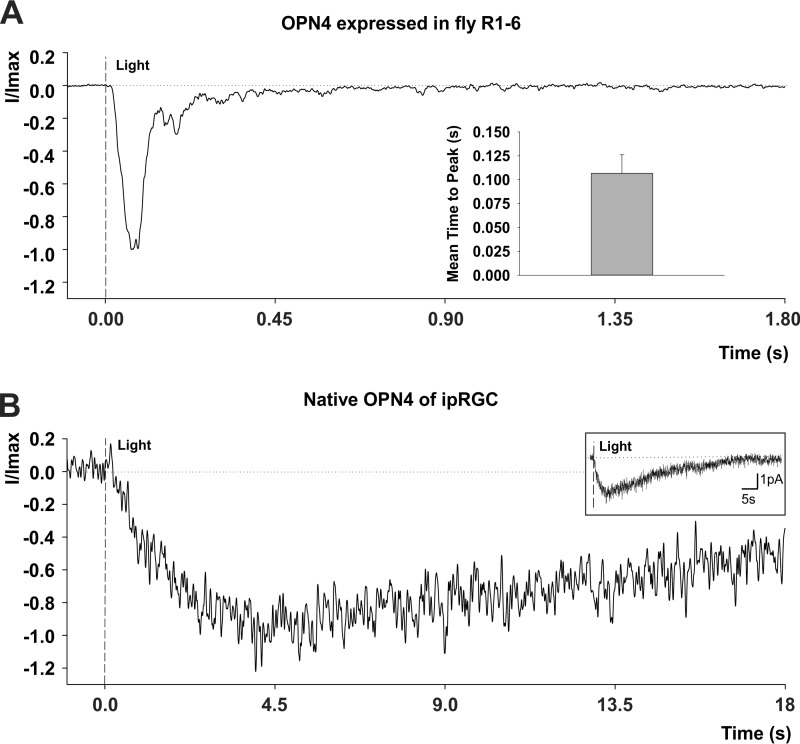
FIGURE 7.
A comparison of the kinetics of LIC of opn4;ninaEI17 transgenic flies and the ipRGC of mice. A, normalized LIC of opn4;ninaEI17 transgenic flies. Whole cell recordings from a single R1–6 cell of opn4;ninaEI17 transgenic flies in response to intense white flash light showing the normalized typical shape of its LIC. Inset, a histogram of the averaged time to peak (from light onset) of the LICs of opn4;ninaEI17 photoreceptors. Error bar, S.E. (n = 10). B, normalized LIC of ipRGC of a mouse. LIC recorded from ipRGC of a mouse using a perforated patch recording. The flash is at time 0 and delivered 2.95 × 10⁶ photons/μm2 (480 nm, 50 ms, covering the somatodendritic compartment). The response is in the linear range of the dark-adapted cell, at room temperature (∼23 °C). Each sweep is filtered at 10 Hz and sampled at 100 Hz; the average normalized LIC is of 14 trials. Inset, the trace of the main figure, presented in an extended time and current scale. (unpublished results from Emanuel and Do (5) with permission of the authors).

