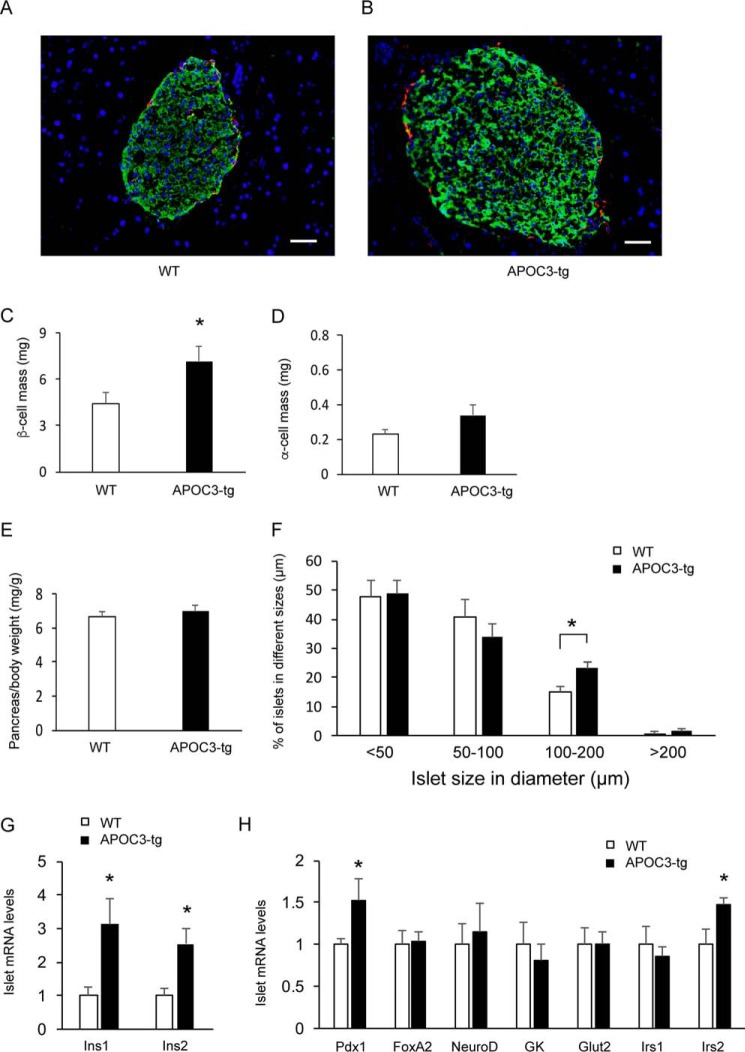
FIGURE 5.
Impact of APOC3 on β-cell and α-cell masses. APOC3-tg and WT mice (male, 6 weeks old, n = 5–7/group) were fed a high fat diet for 10 months. Mice were euthanized at fasting conditions, and the pancreas tissues were subjected to dual immunohistochemistry using anti-insulin and anti-glucagon antibodies. Representative images of pancreatic islets of WT (A) and APOC3-tg (B) mice are shown. β-Cells were immunostained green, and α-cells were immunostained red. C, β-cell mass. D, α-cell mass. E, pancreas weight. The pancreas weight (mg) was normalized to body weight (g). F, islet distribution in size. Islets were scored per pancreas section and were assigned to four subgroups according to islet size, ranging in diameter from <50 to 50–100, 100–200, and >200 μm. 3–5 nonconsecutive sections were scored per pancreas for determining the number of islets in different subgroups according to islet size. The percentage of islets in each subgroup out of total islets was calculated and compared between APOC3-tg and WT mice. G, islet expression of insulin genes. H, islet mRNA levels. Islet mRNA levels were determined by a real-time qRT-PCR assay, using 18S RNA as control. *, p < 0.05 versus WT control. Bar, 50 μm. Error bars, S.E.

