
FIGURE 7.
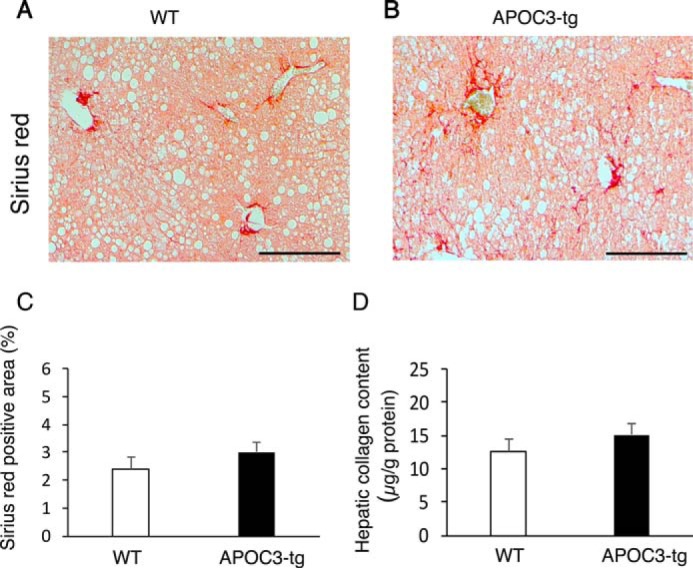
Effect of APOC3 on hepatic fibrosis in high fat-fed APOC3 mice. Liver tissues were derived from high fat-fed WT control (A) and APOC3-tg mice (B) as described in the legend to Fig. 1. Paraffin sections of liver tissues were subjected to Sirius Red staining for collagen. The Sirius Red-positive area in non-consecutive sections was determined by morphometric analysis (C). Aliquots of liver tissues were subject to a collagen assay for determining hepatic collagen content (D), expressed as μg of collagen/g of total liver protein. n = 7–9/group. Bar, 200 μm. Error bars, S.E.