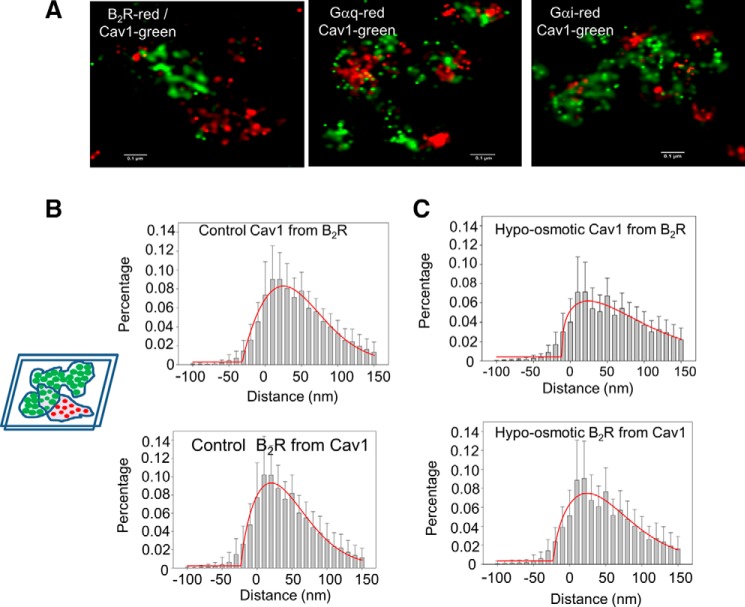
FIGURE 2.
Effect of hypo-osmotic stress on Cav1 and B2R colocalization. A, STORM colocalization images of Cav1 and B2R, Gαq, and Gαi. B and C, distance of histograms showing the percent of Cav1 intensity from the edge of the nearest B2R intensity (upper panels) and the percent of B2R intensity from the edge of the nearest Cav1 intensity (lower panels) at 300 mosm (B) and at 150 mosm (C). The schematic illustrates the masks around the green (top) and red (bottom) pixels where the amount of labeling in one channel at a given distance from the edge of the other channel's mask was calculated to obtain the histograms in the figures. Negative values are obtained when the masks overlap. B and C, total of 126–145 images were measured from 10 to 40 images of six cells in two to three experimental groups with ∼20 to ∼30 caveolae in each image. The image size is ∼1.5 × 1.5 μm. Comparison of the histobars for 300 and 150 mosm at each distance differed with an error of p < 0.001 except for distance <0 where p = 0.227. The red lines correspond to the Gaussian fit of the data.

