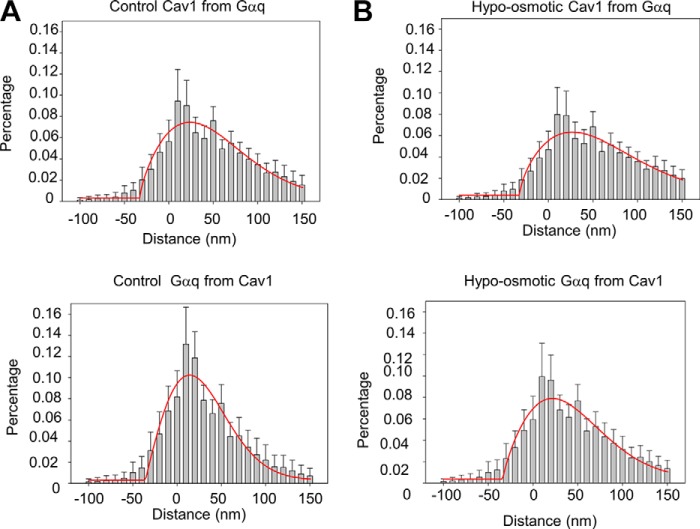
FIGURE 3.
Effect of hypo-osmotic stress on Cav1 and Gαq colocalization. A, distance histogram of the percentage of Cav1 intensity from the edge of the nearest Gαq intensity (upper panel), and the percentage of Gαq intensity from the edge of the nearest Cav1 intensity (lower panel) at 300 mosm; B, at 150 mosm. Data were collected from two to three sets of experiments with 9–38 images measured in each cell, and six to seven cells were measured in each group to give a total of 132–158 images. The image size is ∼1.5 × 1.5 μm. Comparison of the histobars for 300 and 150 mosm at each distance differed with an error of p < 0.001 except for Cav1 from Gαq distance <0 where p = 0.054. The red lines correspond to the Gaussian fit of the data.

