FIGURE 1.
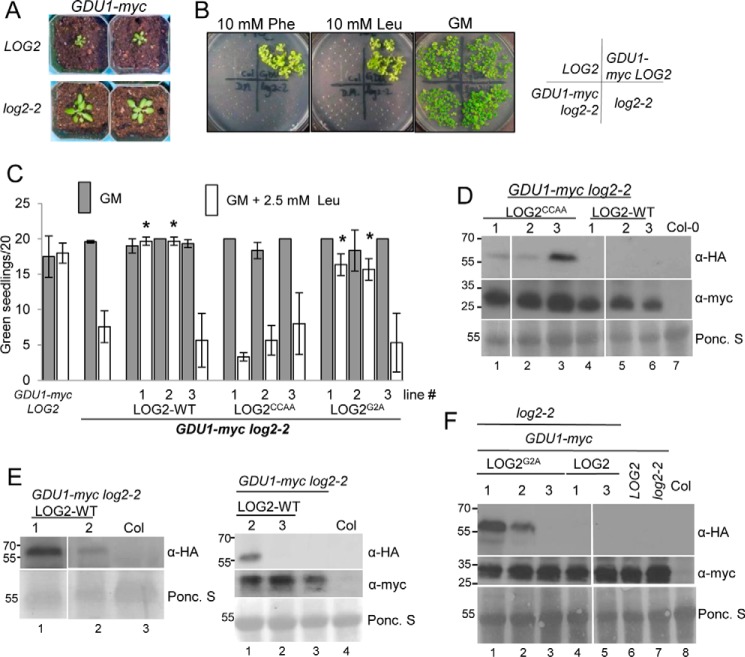
Wild-type and myristoylation-defective LOG2 proteins restore the Gdu1D amino acid resistance phenotype in GDU1-myc log2-2 plants, but a catalytically inactive LOG2 protein does not. A, 3-week GDU1-myc log2-2 soil-grown plants are larger than age-matched GDU1-myc LOG2 siblings. B, GDU1-myc log2-2, GDU1-myc LOG2, and the non-GDU1-myc lines: control wild-type LOG2 (Col-0) or log2-2 alone seed were plated on GM (right) or GM supplemented with 10 mm phenylalanine (Phe) or leucine (Leu) and photographed after 2 weeks of growth. C, LOG2CCAA-HA, LOG2G2A-HA, and wild-type LOG2-HA transgenes were introduced into the GDU1-myc log2-2 background, triple homozygous seed was plated on GM (filled) or Leu-supplemented GM (open), and the number of green seedlings with expanded true leaves after 10 days of growth at RT were counted. 20 seeds per line were plated in 3 independent experiments. Asterisks indicate significantly different numbers of green seedlings compared with the progenitor GDU1-myc log2-2 line on GM + Leu as assessed by one-way analysis of variance (p < 0.05); all others on GM + Leu were not significantly different from the progenitor. Error bars represent twice the S.E. Seed from GDU1-myc LOG2 (left) and the GDU1-myc log2-2 progenitor (second from left) served as controls. D--F, immunoblots detecting wild-type and mutant LOG2-HA (top panels, anti-HA) and GDU1-myc (middle panels, anti-Myc) protein levels in 10-day-old seedlings grown on GM. Ponc. S (bottom panels), Ponceau stain loading controls. Molecular weight markers in kDa are shown on the left of each blot. Col is wild-type non-transformed control (name of ecotype for Columbia). Genetic background is indicated with bars above the blots. D, protein in LOG2CCAA lines. E, wild-type LOG2 lines. F, LOG2G2A lines. Immunoblots for LOG2CCAA and LOG2G2A lines (D and F) represent signal from 150 μg of total protein. Visualization of LOG2-HA signal (E) required a more sensitive ECL detection kit, longer exposure times, and more total protein compared with D and F (200 or 300 μg for the left and right blot, respectively). White lines in D and F denote removal of uninformative lanes from the same blot.

