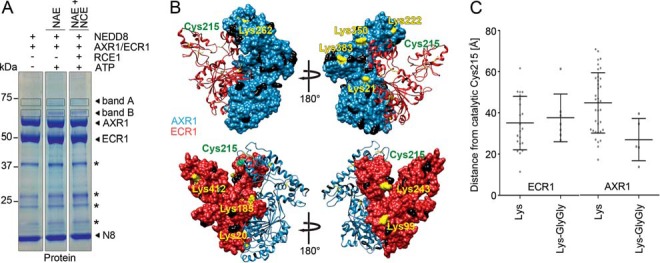
FIGURE 2.

Identification of modified lysines in NEDD8 NAE subunits. A, SDS-PAGE of thioester reactions of NAE (FLAG:AXR1/ECR1:His), NAE and NCE (His:FLAG:RCE1), and NEDD8 (His:HA:NEDD8) reduced with DTT and stained for total protein with Coomassie Brilliant Blue (Protein). Bands A and B were excised from each lane and analyzed by LC-MS/MS. B, Swiss-Model structure prediction of AXR1 (blue) and ECR1 (red) based on the structure of human NAE (APPBP1/UBA3; Protein Data Bank accession 1YOV (8)). The model was analyzed using the Chimera software. Lys residues with a Gly-Gly modification as identified by mass spectrometry are shown in yellow; non-modified Lys residues are shown in black, and the catalytically active Cys-215 of ECR1 is shown in green. C, graph displaying the direct physical distances between the Cα positions of the catalytically active Cys-215 of ECR1 and the Lys residues of AXR1 or ECR1. Graphs show the average distance and S.D. for all unmodified Lys residues or Lys residues carrying a GlyGly-modification (LysGlyGly). * indicates background bands.
