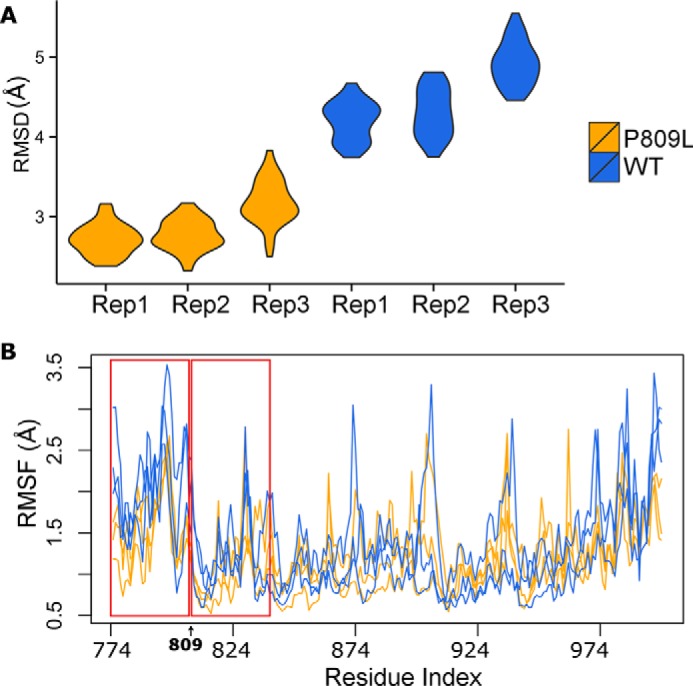
FIGURE 3.

Molecular dynamic simulations at 360 K. MD simulations were run for 2 and 10 ns with similar results. Similar to Fig. 2, we compared WT to p.P809L using RMSD (A) and RMSF (B). The p.P809L variant displays wider changes in RMSD. The lower panel shows RMSF as an indication of the flexibility of the protein expressed by the distance that each residue moves during the simulation.
