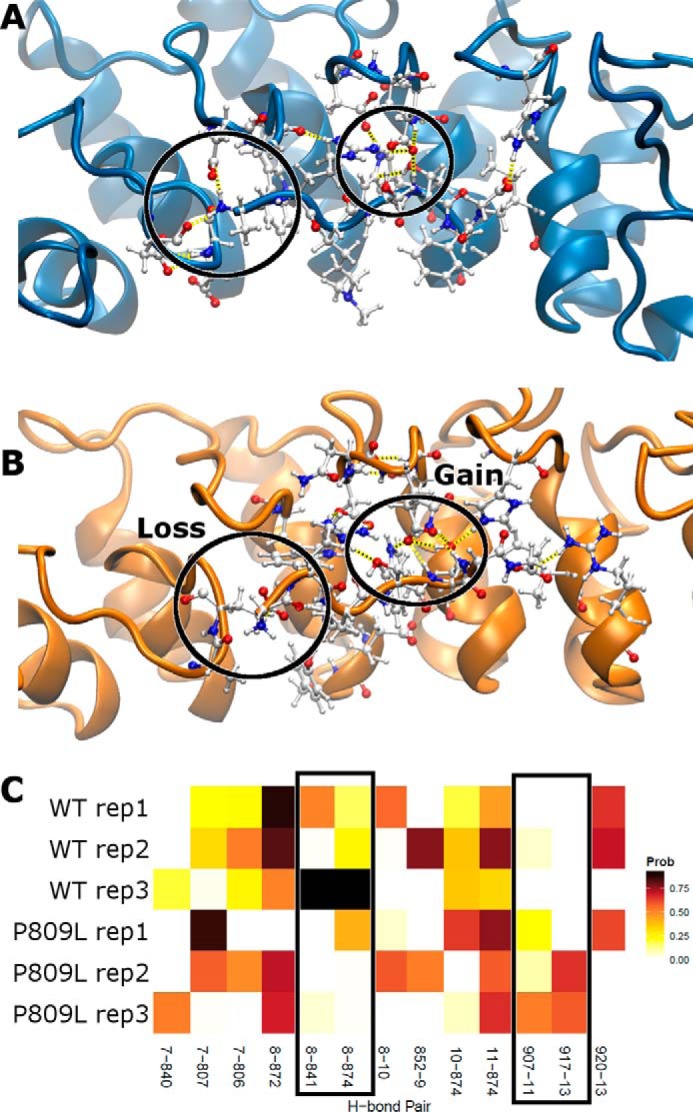
FIGURE 5.

Altered interactions between EHMT1 and its target. We show the WT (A) and p.P809L (B) with residues within and nearby the target peptide shown in detail. Hydrogen bonds are represented as dashed yellow lines. Throughout the simulations, the WT and p.P809L demonstrate differences in hydrogen bonding as visible in A and B and quantified in C where the probability of each hydrogen bond interaction is shown. Two pairs are present across WT replicates and lost for p.P809L, whereas two pairs are not present in the WT, but are common in p.P809L (boxed). The abscissa indicates the residue numbers of interacting residues with the donor residue listed first; residues 7–13 are from the histone tail peptide.
