FIGURE 8.

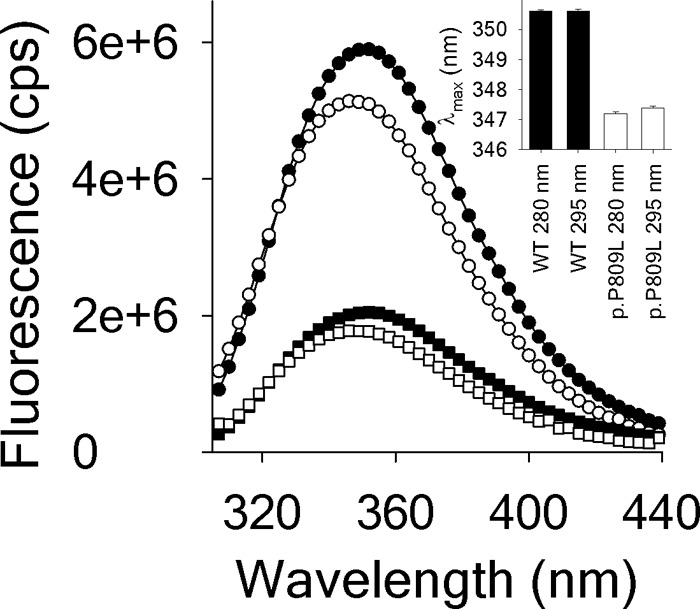
Fluorescence emission spectra of WT EHMT1 and of p.P809L. Fluorescence emission spectra of WT EHMT1 (solid symbols and bars) and of p.P809L (open symbols and bars) were obtained. Spectra were recorded at 20 °C using a protein concentration of 1 μm. The excitation wavelengths (λEx) were 280 nm (circles; excitation of Trp and Tyr residues) and 295 nm (squares; selective excitation of Trp residues). The inset illustrates the differences in the wavelength of the maximum intensity (λmax).
