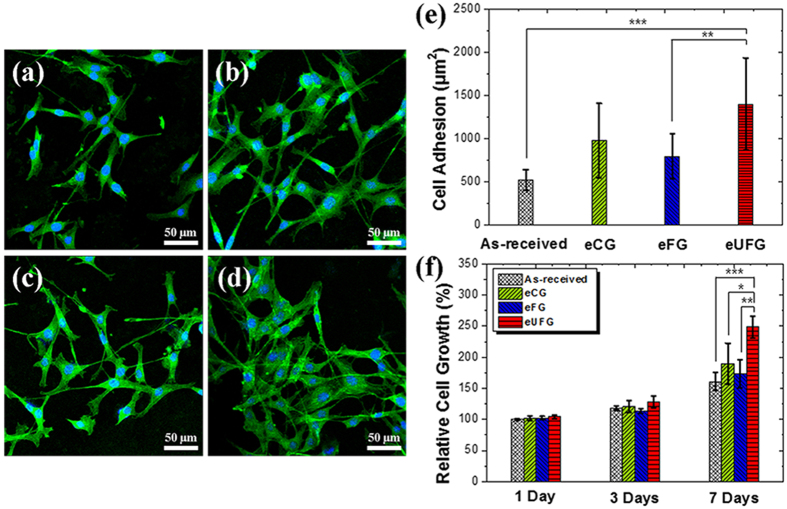
Figure 4. Pre-osteoblast cells spreading on the surfaces and proliferation rate.
Fluoresence images of F-actin (green) and nucleus (blue) stained cells on (a) the as-received, (b) eCG, (c) eFG, and (d) eUFG substrates after 3 days. (e) The average cell adhesion area on each substrate by measuring the region of F-actin fluorescence using image J software (***p < 0.001 and **p < 0.01). The fluorescence images of F-actin were used false color from red to green, and merged with the nucleus fluorescence images. (f) Proliferation rate of the pre-osteoblast cells with a reference of the as-received CP-Ti substrate (***p < 0.001, **p < 0.01, and *p < 0.05).

