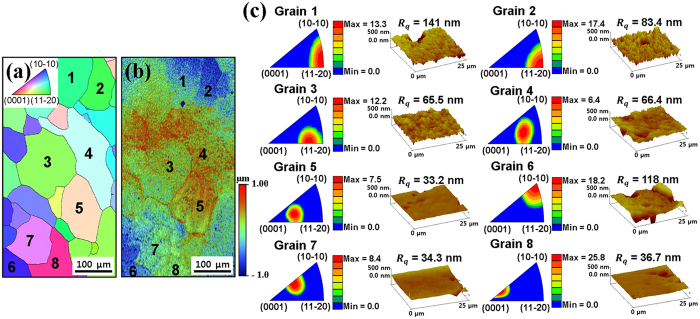
Figure 5. The orientation and surface roughness of each grain after etching.
(a) EBSD micrographs and (b) optical profilometry images in the same region on the as-received substrate. Each number points out each grain. (c) Inverse pole figures of normal direction and surface topography (scan area 30 × 30 μm2) with Rq values of each grain.

