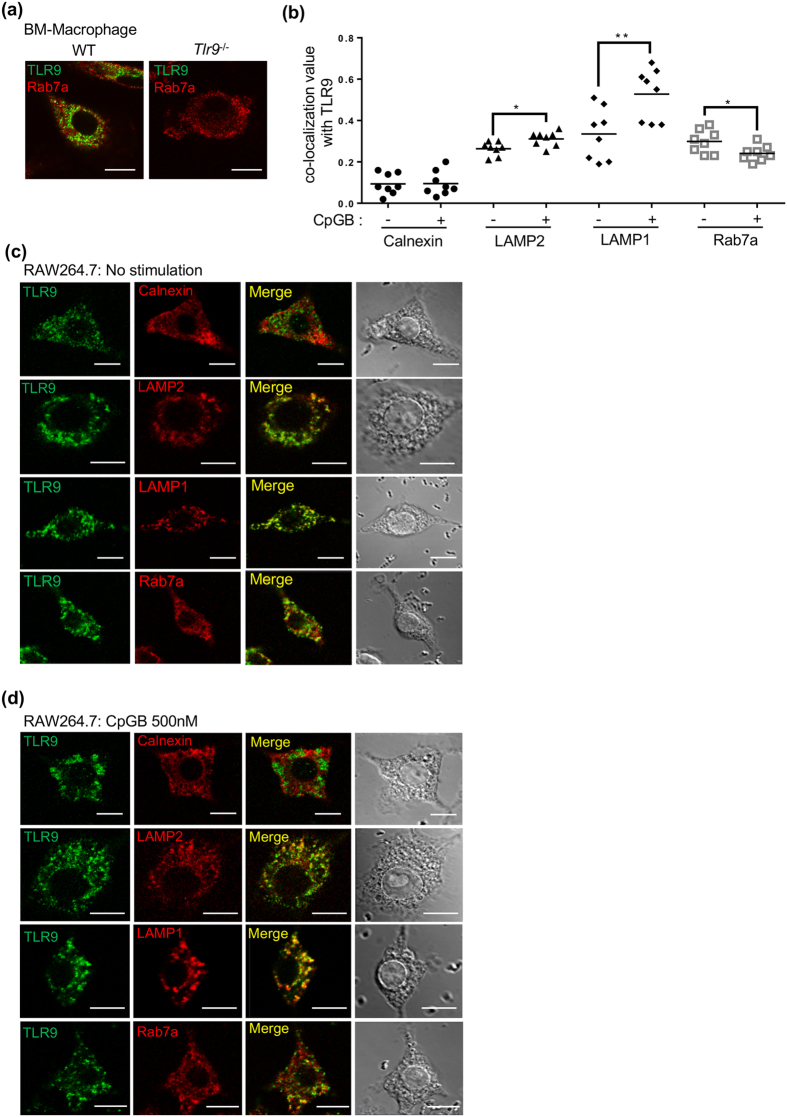
Figure 5. Endogenous TLR9 is localized in late-endosomes/lysosomes.
(a) BM-Macs from WT or Tlr9−/− mice were stained with NaR9. Rab7a was stained as a marker of late-endosomes. (b–d) RAW264.7 cells were stained with NaR9 and Abs to Calnexin, LAMP2, LAMP1 or Rab7a as a marker of ER, lysosomes or late-endosomes. (b) Pearson’s correlation coefficients were calculated using LSM710 ZEN software for the statistical analysis of co-localization and shown as absolute values. A Pearson’s coefficient of <0.2 represents poor co-localization. Each set of eight cells were used for statistical analysis. (c,d) Cells were incubated with or without CpGB (500 nM) for 24 h. Data were compared by performing a Student’s t-test: *p < 0.05, **p < 0.01 (b). These experiments were repeated at least twice, and representative data are shown. Scale bar, 10 μm.

