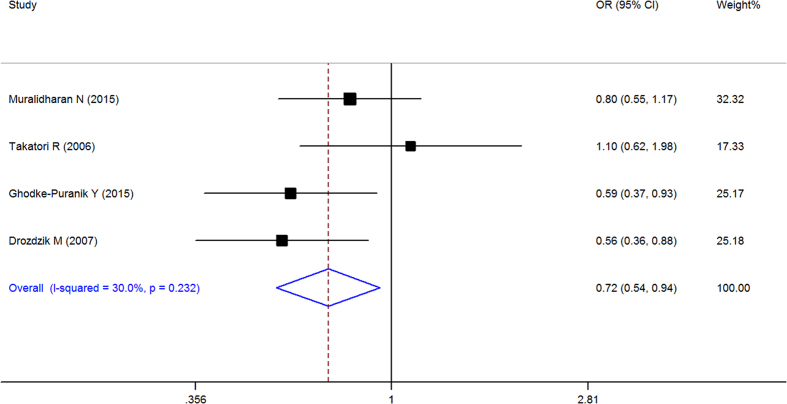
Figure 8. Forest plot showing the association between the RFC-1 80G > A (rs1051266) single-nucleotide polymorphism and the efficacy of methotrexate (G vs. A (Pre-allele model)).
% weight: the percentage weight attributed to each study in the meta-analysis; OR: odds ratio. Point estimates of the ORs for each study (black squares) and the corresponding 95% confidence intervals (CI) (horizontal lines) are shown, with the size of the black square representing the relative weight of study. The diamond represents the overall pooled estimate.

