
Figure 4. Association of PD-L1 tumor cell abundances and immune cell populations in tumor tissues and blood determined by flow cytometry.
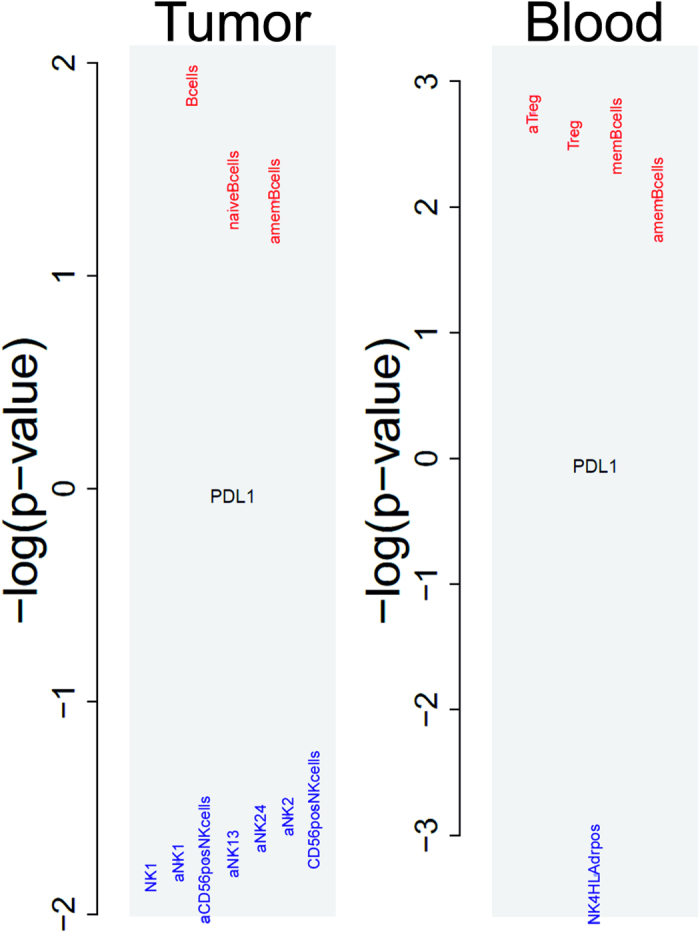
In tumor tissues B-cells (comprising naïve and memory B-cells) showed a positive and CD56 positive NK cells including different sub-populations (NK1 and NK2) a negative association. In blood, regulatory T-cells and memory B-cells showed a positive and HLA-DR positive NK4 cells a negative correlation. (“a.” before the cell population name means absolute values, otherwise relative frequencies; y-axis, negative log10 p-values – if positive, a positive correlation, if negative, a negative correlation is indicated.