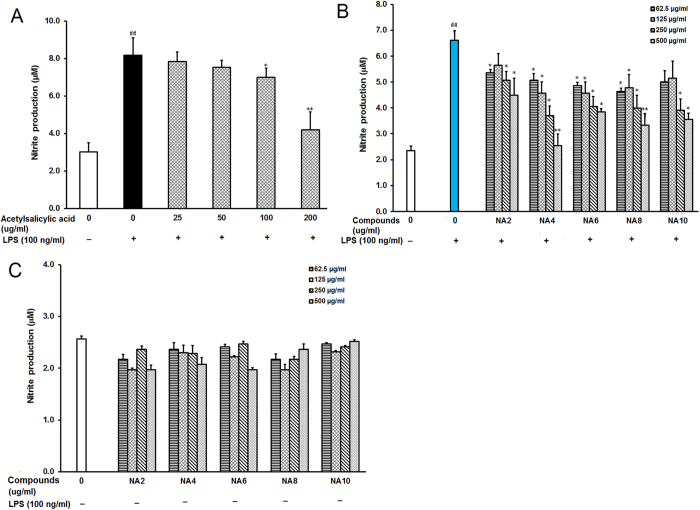
Figure 2. Effects of neoagaro-oligosaccharides on LPS-induced production of NO in RAW264.7 cells.
(A) After pre-treatment of cells with different concentrations of acetylsalicylic acid (25, 50, 100, 200 μg/ml) for 2 h, the LPS (100 ng) was added to cells and incubated for 16 h. Then the content of nitrite in cell supernatant was determined by ELISA. Values are means ± SD (n = 3). Significance: ##P < 0.01 vs. normal control; *P < 0.05, **P < 0.01 vs. LPS treated control. (B) After treatment of cells with different neoagaro-oligosaccharide monomers (NA2, NA4, NA6, NA8, NA10) at indicated concentrations (62.5, 125, 250, 500 μg/ml) for 2 h and 100 ng LPS for 16 h, the content of nitrite in cell supernatant was measured by ELISA. Values are the mean ± SD (n = 3). Significance: #P < 0.05, ##P < 0.01 vs. normal control; *P < 0.05, **P < 0.01 vs. LPS treated control. (C) After the treatment of cells with different neoagaro-oligosaccharide monomers (NA2, NA4, NA6, NA8, NA10) at indicated concentrations (62.5, 125, 250, 500 μg/ml) for 16 h, the content of nitrite in cell supernatant was measured by ELISA. Values are the mean ± SD (n = 3).

