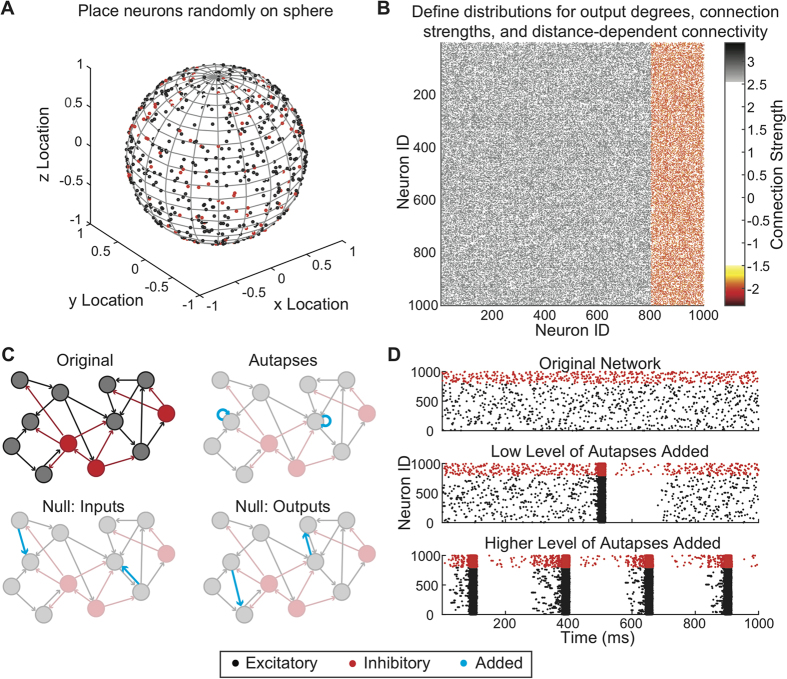
Figure 1. Schematic of Empirical Methods.
(A) Excitatory and inhibitory neurons were placed uniformly at random on the surface of a sphere. (B) Coupling between neurons was constructed using well-defined distributions for node strength, and by implementing a set probability of connection fall-off with distance. The resulting coupling matrix is a weighted, directed adjacency matrix. (C) Autapses were added to either inhibitory or excitatory neurons to determine their effect on network dynamics, in comparison to appropriate statistical null models where input or output connections were added in place of autapses. (D) We measured the effects of autapses on the dynamics of the network activity by quantifying firing rate and network-wide bursts.

