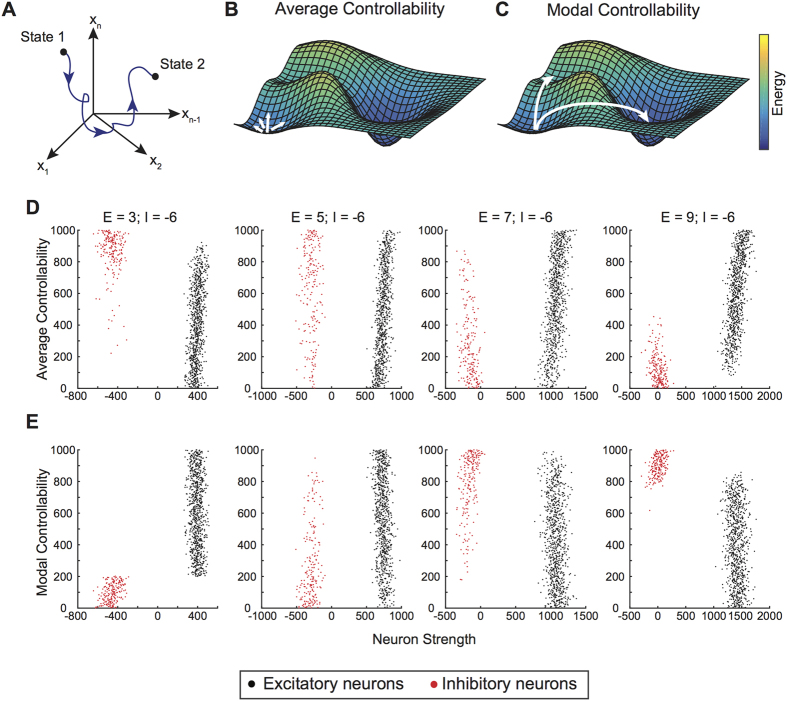
Figure 3. Notions of Network Control and Their Relationships to Topology.
(A) Schematic illustrating the idea that a controllable network can be driven from an initial state to a final state in some multidimensional landscape within a finite time period. (B) Illustration of a 3-dimensional energy landscape on which nodes with high average controllability drive the system from a baseline state to many easily reachable states (arrows). One example of an easy to reach state is when a network is bursting at low, irregular frequency and transitions to a new, more regular bursting state. Alternatively, an easy to reach state for a nonbursting network is to maintain this nonbursting state. (C) Illustration of the same 3-dimensional energy landscape on which nodes with high modal controllability drive the system to difficult-to-reach states, from one energy minimum to another over a large energy barrier (arrows). An example of a difficult to reach state is when a bursting network transitions to a non-bursting network. (D) As excitatory synaptic strength in the network is increased while inhibitory strength is held constant, the nodes with the highest average controllability shift from the inhibitory to the excitatory network. At low excitatory levels, the network is not bursting and an easy to reach state is to maintain this nonbursting activity; hence the highest average controllability resides with the inhibitory network. (E) Over the same span of network configurations, highest levels of modal controllability appear in the excitatory network at low synaptic strength and shifts to the inhibitory network at high excitatory synaptic strengths. At high synaptic strengths, the network is bursting regularly and controllability of inhibitory neurons is key to bring the network to a difficult to achieve, nonbursting state.

