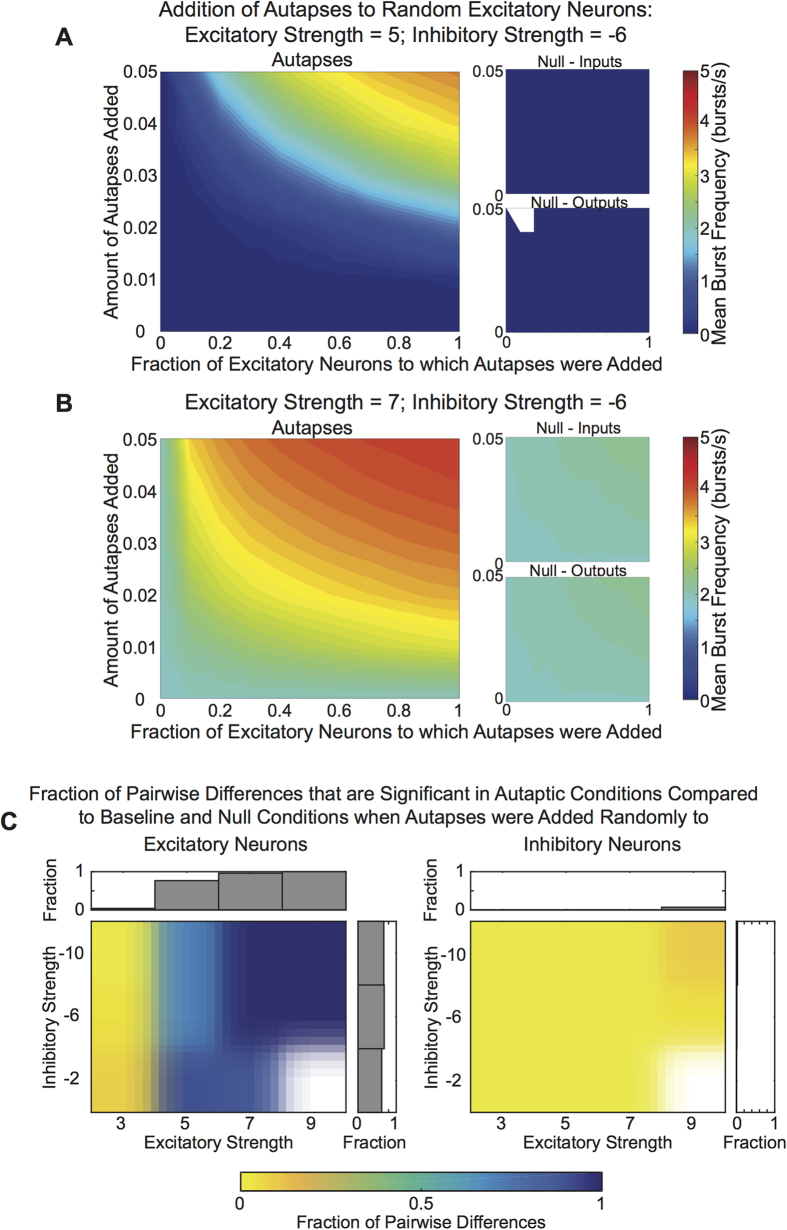
Figure 4. Role of Autapses on Excitatory Neurons in Network-Wide Bursts.
(A) Burst frequency for an example simulation in the autaptic model (left) in which autaptic connections were added to excitatory neurons uniformly at random, or in two null models (right) in which non-autaptic connections were added to maintain either the number of input connections (an input null model) or to maintain the number of output connections (an output null model). This network used a mean excitatory and inhibitory strength of 5 and -6, respectively. The abscissa shows the fraction of the excitatory neurons that had modified connectivity. The ordinate gives the amount of connections added, defined as a fraction of the neuron’s original number of outputs. (B) The same type of information presented in panel (A), except here shown for a network that had a mean excitatory strength of 7 and a mean inhibitory strength of −6. (C) The fraction of autaptic conditions (fraction of neurons x amount of autapses; see Methods) within a given excitation and inhibition level that were significantly different from the original baseline network and from the corresponding input and output null models when autapses are added to excitatory (left) versus inhibitory (right) neurons. Bar graphs show the fraction of conditions that were significantly different from the baseline network and from control conditions across a particular excitatory or inhibition level.

