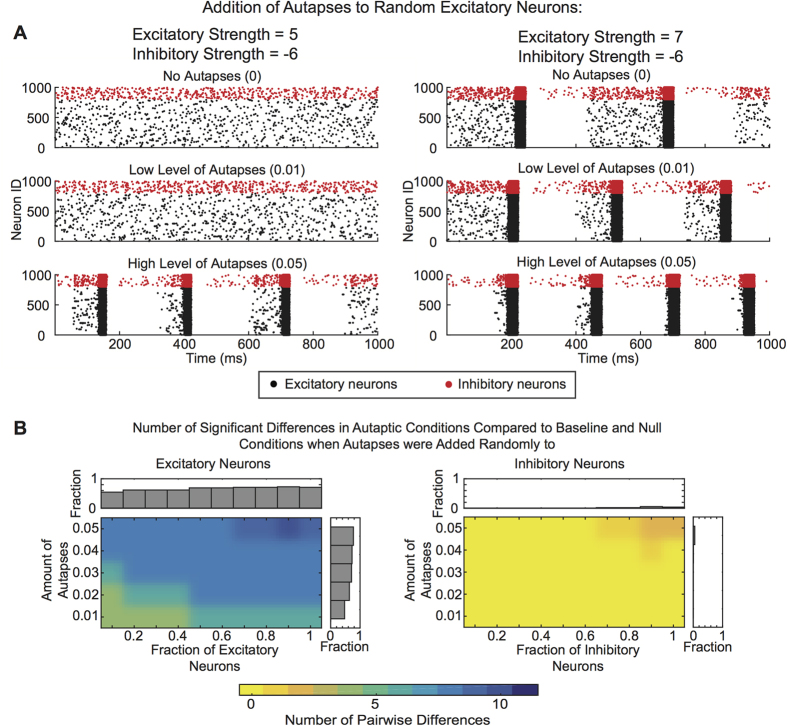
Figure 5. Effect of Amount of Autapses on Network Dynamics.
(A) Raster plots showing 1 s of activity for networks with lower (left) and higher (right) excitation levels, as the amount of autpases is varied from 0% (top) to 5% (bottom). (B) The fraction of excitatory and inhibitory strength pairs at which the bursting frequency after addition of autapses was significantly different from the bursting frequency at baseline or in the null models. Number of pairwise differences are given as a function of the amount of autapses added, as well as the fraction of excitatory (left) and inhibitory (right) neurons. Bar graphs show the fraction of excitatory/inhibitory strength pairs that produced bursting frequencies that were significantly different from the baseline network and control conditions across the amount of autapses added.

