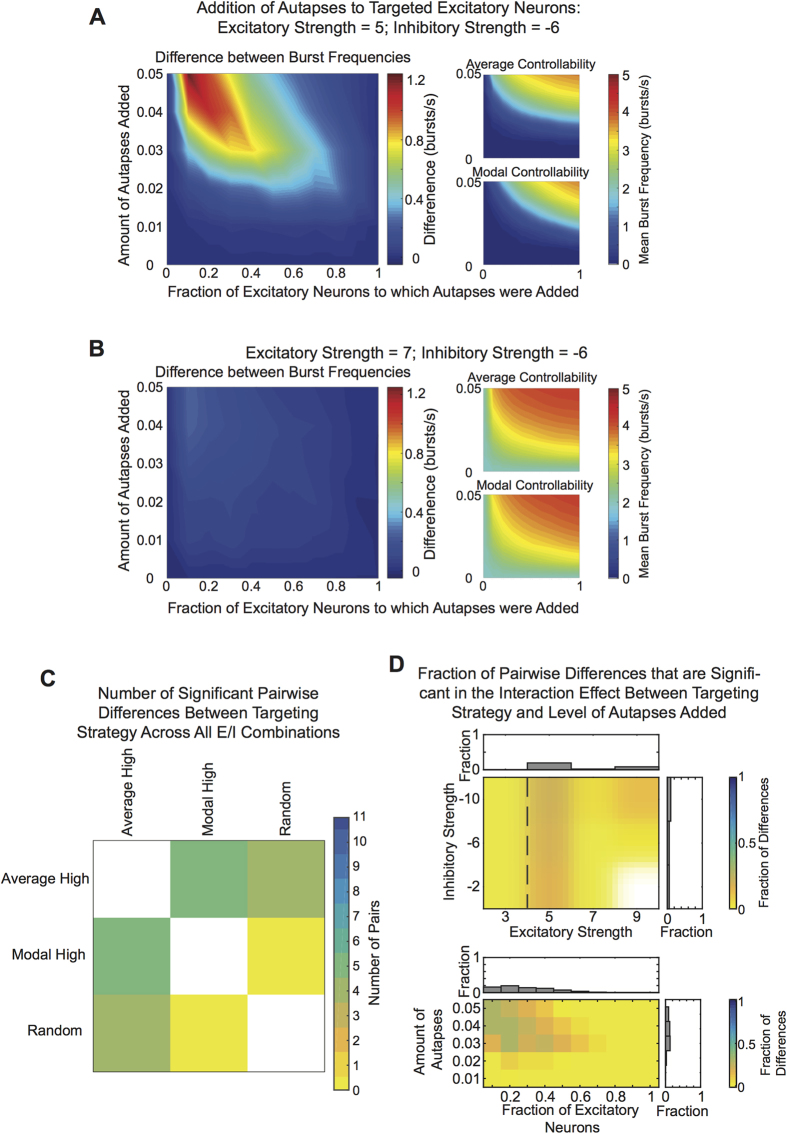
Figure 6. Targeting Autapses to Control Points in the Network.
(A, left) Difference in the burst frequency when autapses were added to the highest average controllability neurons versus the highest modal controllability neurons, as a function of the fraction of excitatory neurons to which autapses were added, for example simulations. (A, right) Observed burst frequency when autapses were added to the highest average (top) versus highest modal (bottom) controllability neurons for example simulations. The abscissa shows the fraction of the excitatory neurons to which autapses were added. The ordinate gives the amount of connections added, defined as a fraction of the neuron’s original number of outputs. (B) Similar data to that presented in panel (A) except here for a higher level of excitation. (C) Number of significant pairwise differences – across all eleven excitation and inhibition combinations – in burst frequency for networks constructed from the two targeting strategies. (D, top) Fraction of significant pairwise differences in burst frequency in the interaction effect between targeting strategy and amount of autapses added, within each excitatory/inhibitory strength combination. (D, bottom) Fraction of pairwise differences in burst frequency across excitatory and inhibitory strength combinations at each autaptic condition (fraction of neurons x amount of autapses). Bar graphs show the fraction of excitatory/inhibitory strength pairs that produced bursting frequencies that were significantly different between the targeting strategies across the amount of autapses added.

