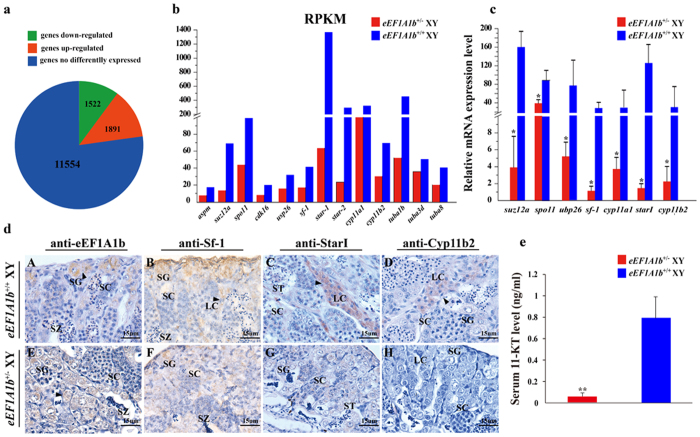
Figure 8. Transcriptomic analyses of gene expression profiles in eEF1A1b+/− testis at 180 dah.
(a) Testis expressed genes were divided into three parts: 1522 down-regulated genes, 1891 up-regulated genes, and 11554 non-differentially expressed genes. (b) Validation of genes with disrupted expression files from transcriptome data by real-time PCR. All examined genes displayed similar expression profiles to those from the transcriptome data. (c) Validation of genes with disrupted expression files from transcriptome data by IHC. Arrowheads indicate the positive signal. SG, spermatogonia; SC, spermatocytes; ST, spermatids; SZ, spermatozoa; LC, Leydig cells. (d) Serum 11-KT levels of the eEF1A1b+/− and eEF1A1b+/+ XY fish.

