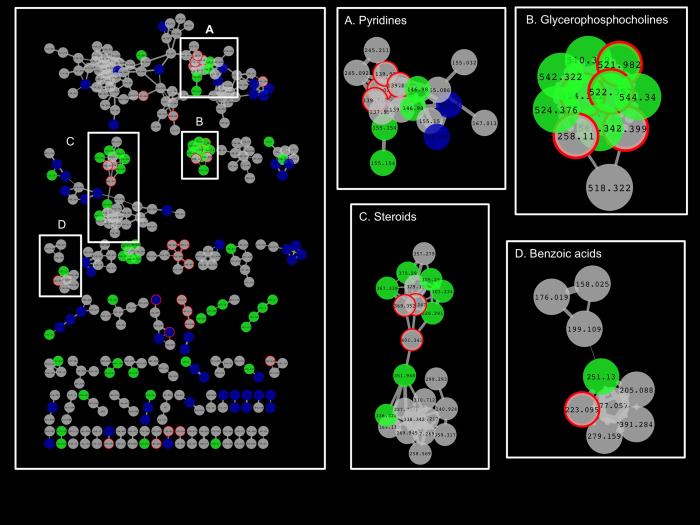
Figure 2. Chemical-similarity maps of small molecules (n = 494 with MS/MS spectrum) in fish tissue (Tanimoto coefficient ≥0.7).
Green and blue nodes represent small molecules observed only after in vivo SPME sampling and ex vivo SPME sampling, respectively. Grey nodes represent small molecules detected using both sampling methods. Nodes with red border indicates annotated molecule by matching LC-MS/MS libraries with spectral similarity ≥0.7 Edge represents similarity between MS/MS spectra. Thickness of the edges indicates the level of similarity (the thicker is an edge, the more similar are MS/MS spectra).

