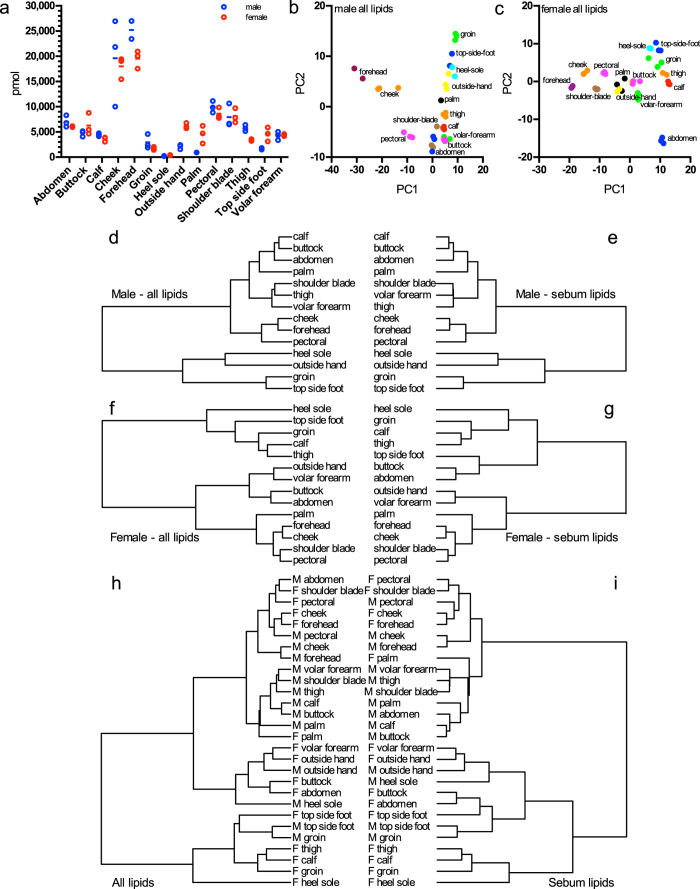
Figure 3. Intra-individual variability.
(a) Amounts of lipids measured in different sampling sites. Lines connect mean values. (b,c) Principal component analysis of the (b) male and (c) female site lipidomes containing lipid sub-species molpercent as input. (d–i) Hierarchical clustering of different site lipidomes according to correlations between their lipid subspecies. (d) and (e) are male sites, with all (d) and only sebum lipids (e) used; (f) and (g) are female sites, with all (f) and only sebum lipids (g) used. (h) and (i) cluster sites from both sexes with all (h) and sebum only (i) lipids. M and F indicate sexes.

