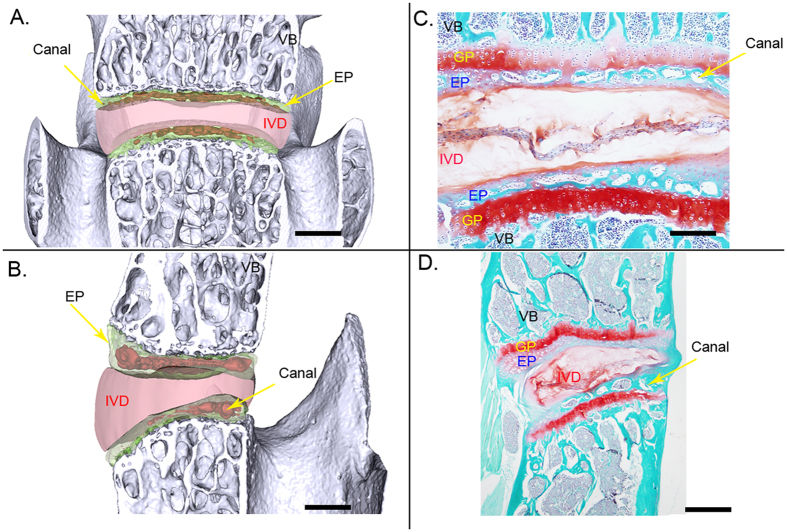
Figure 2. Comparison of the surface rendering images of the sagittal and coronal sections acquired with PPCST with images of histological samples.
(A and B) Virtual sagittal and coronal sections acquired using PPCST. Canals located in the endplate and disc were clearly visualized. (C and D) Corresponding section images with Saf-O staining. Scale bar = 1 mm. VB = vertebral body, EP = endplate, GP = growth plate, IVD = intervertebral disc.

