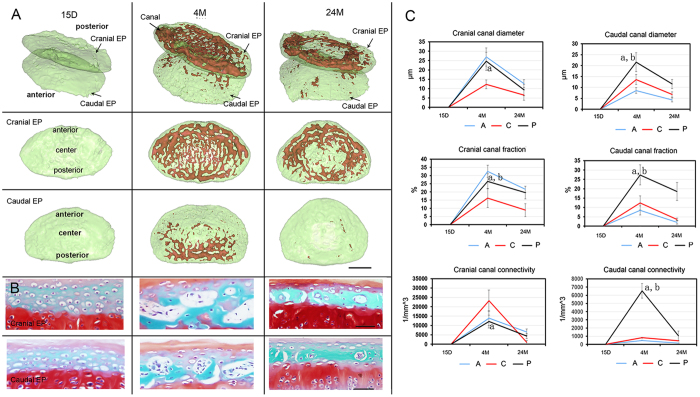
Figure 5. 3D digitalized map quantitative information of the canal network for various ages.
(A) Lateral view of 3D image of the canal network in the endplate after aging obtained using PPCST with the cranial and caudal endplates separately displayed. The endplate was divided into three different regions, anterior, center and posterior. (B) Representative image of the corresponding histology sections of the cranial and caudal endplates for various ages. (C) Quantitative analysis of the morphological parameters in the cranial and caudal endplates in three regions after aging. Scale bar = 1 mm; A = anterior; C = center; P = posterior. Data are the means ± S.D., n = 8 mice in each group. In panel (B), a indicates a significant difference between the posterior region and the center region, and b indicates a significant difference between the posterior region and the anterior region (p < 0.05, determined by two-way repeated measures ANOVA with Bonferroni’s post hoc test).

