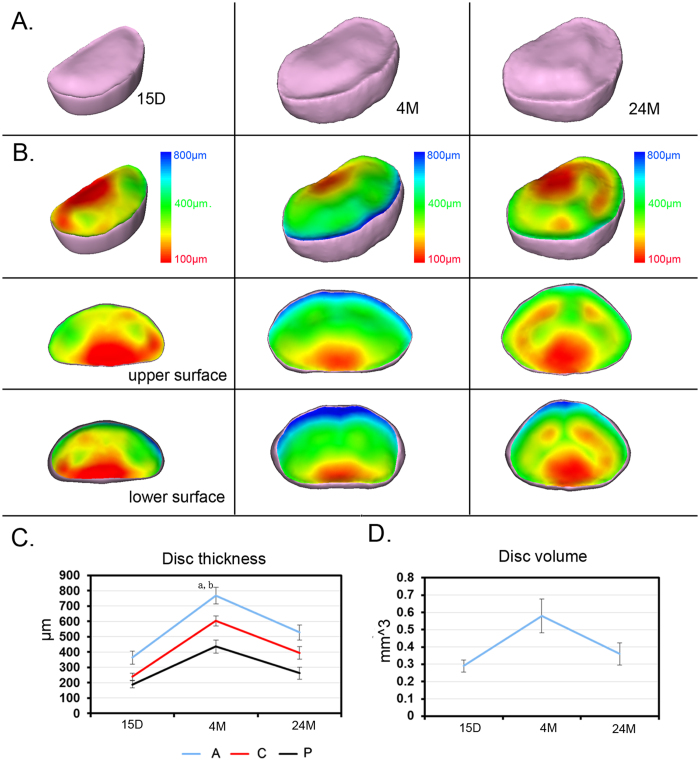
Figure 7. 3D characterization of IVD at different ages.
(A) Vertical view of the 3D images of the IVD from mice of different ages. (B) Corresponding pseudo-color image coding with the IVD thickness; the upper and lower surfaces of the IVD are separately displayed. The pseudo-color bar in the lower right corner indicates the diameter ranges of IVD thickness. The blue color represents the largest diameter, whereas the red indicates the smallest diameter. (C) Quantitative analysis of changes in volume and thickness distribution in anterior, center and posterior regions and of IVD for different ages. Scale bar = 1 mm, A = anterior; C = center; P = posterior. In panel (B), a indicates a significant difference between the anterior region and the posterior region, and b indicates a significant difference between the anterior region and the posterior region (p < 0.05, determined by two-way repeated measures ANOVA with Bonferroni’s post hoc test).

