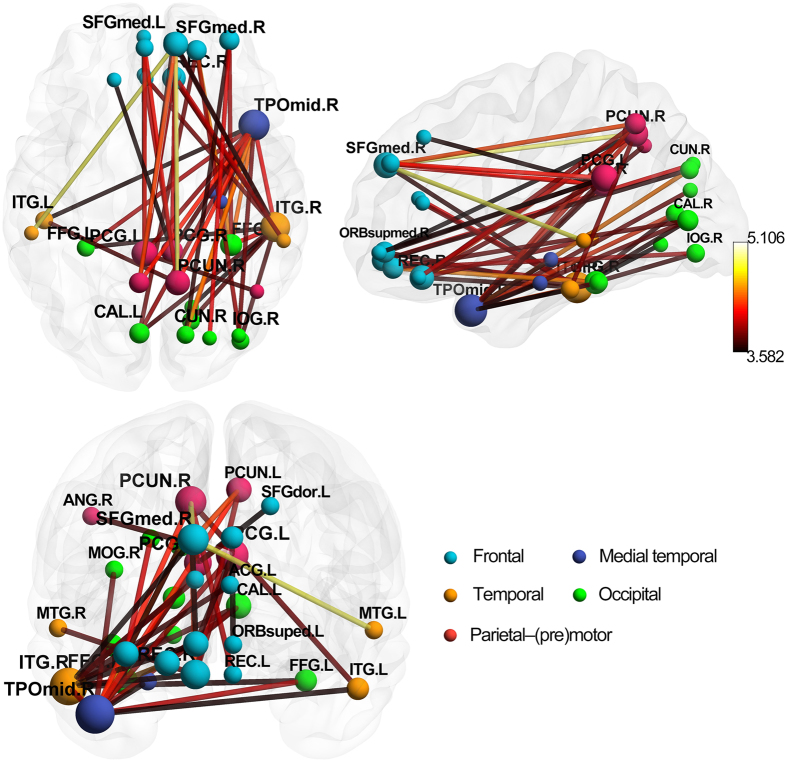
Figure 2. Decreased functional connections in the SAD group compared with the control group.
There are 49 decreased connections which were significantly (FDR corrected p = 0.05) abnormal in the patients. All of 32 brain regions are marked by using different colored spheres (different colors represent distinct brain classification) and further mapped onto the cortical surfaces at the lateral, medial and top views, respectively, by using the BrainNet Viewer package (www.nitrc.org/projects/bnv). The size of the spheres represents the number of altered connections they involved. The color of the edges represents the t value of the comparisons, and the color bar is on the left side. ACG, anterior cingulate and paracingulate gyri; ANG, angular gyrus; CAL, calcarine fissure and surrounding cortex; CUN, cuneus; FFG, fusiform gyrus; IOG, inferior occipital gyrus; ITG, inferior temporal gyrus; MOG, middle occipital gyrus; MTG, middle temporal gyrus; ORBsuped, superior frontal gyrus, medial orbital; PCG, posterior cingulate gyrus; PCUN, precuneus; REC, gyrus rectus; SFGdor, superior frontal gyrus, dorsolateral; SFGmed, superior frontal gyrus, medial; TPOmid, temporal pole: middle temporal gyrus.

