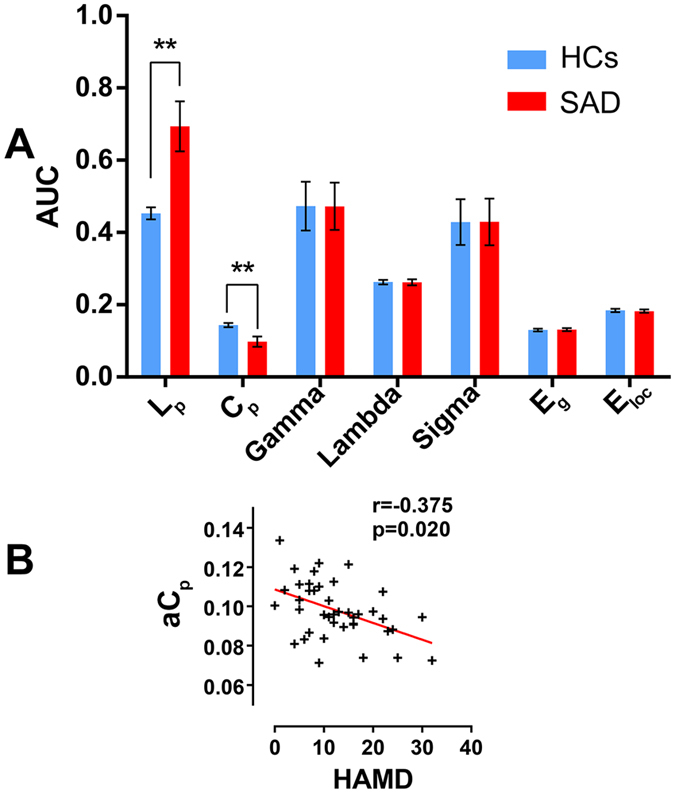
Figure 4. Global topology of functional connectivity networks in the SAD and control groups.

Part A: Topological properties of functional connectivity networks in SAD and controls are shown in different colors. The error bars represent standard deviation. ** Group difference is significant at the 0.01 level (FDR corrected) based on non-parametric permutation tests. Part B: Scatter plots in part B show significant correlation between the global topological characteristics and HAMD scores in the SAD group (p < 0.05). SAD, social anxiety disorder; HCs, health controls; AUC, area under the curve; Lp, shortest path length; Cp, clustering coefficient; γ, the normalized clustering coefficient; λ, the normalized characteristic path length; σ, small-world measure; Eglob, global efficiency; Eloc, local efficiency; aLp AUC of shortest path length; aCp, AUC of clustering coefficient; HAMD, Hamilton Rating Scale for Depression.
