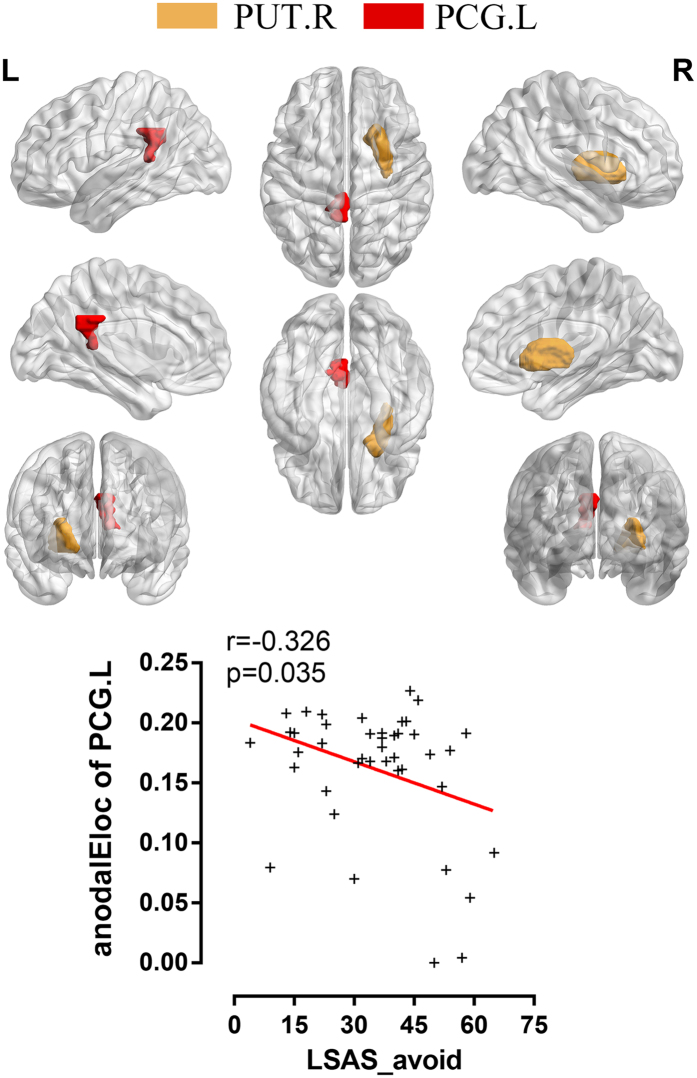
Figure 5. Altered regional brain topological parameters in the SAD.
The colored areas show the location of left posterior cingulate gyrus and the right putamen in the Automated Anatomical Labeling atlas. Scatter plots show significant correlation between the nodal local efficiency in left posterior cingulate gyrus and avoidance score of LSAS in the SAD group (p < 0.05). PUT.R, right putamen; PCG.L, left posterior cingulate gyrus; anodalEloc, area under the curve of nodal local efficiency; LSAS_avoid, avoidance score of Liebowitz Social Anxiety Scale.

