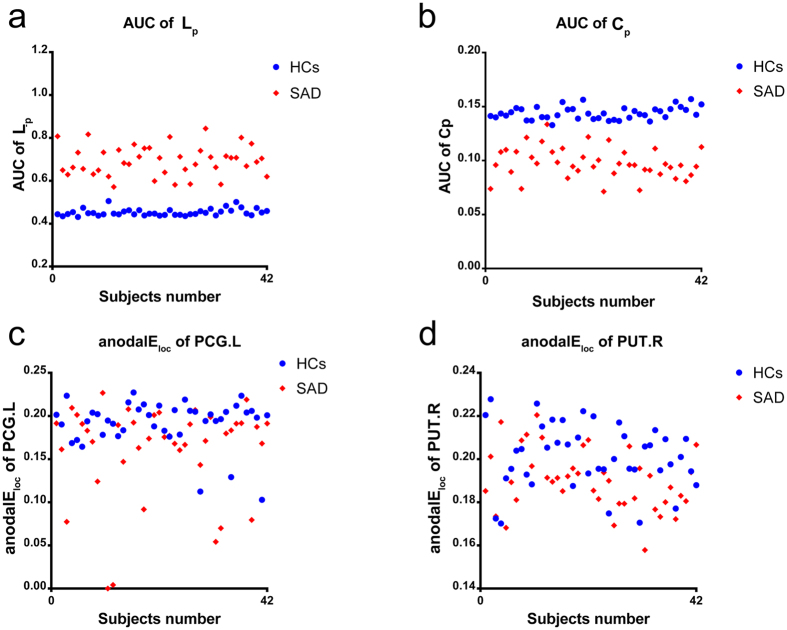
Figure 6. The individual network features in both SAD and control groups.
The network features which can discriminate SAD from healthy controls effectively were abstracted. (a) the AUC of Lp, (b) the AUC of Cp, (c) the anodalEloc of PCG.L and (d) the anodalEloc of PUT.R. SAD, social anxiety disorder; HCs, health controls; AUC, area under the curve; Lp, shortest path length; Cp, clustering coefficient; anodalEloc, area under the curve of nodal local efficiency; PCG.L, left posterior cingulate gyrus; PUT.R, right putamen.

