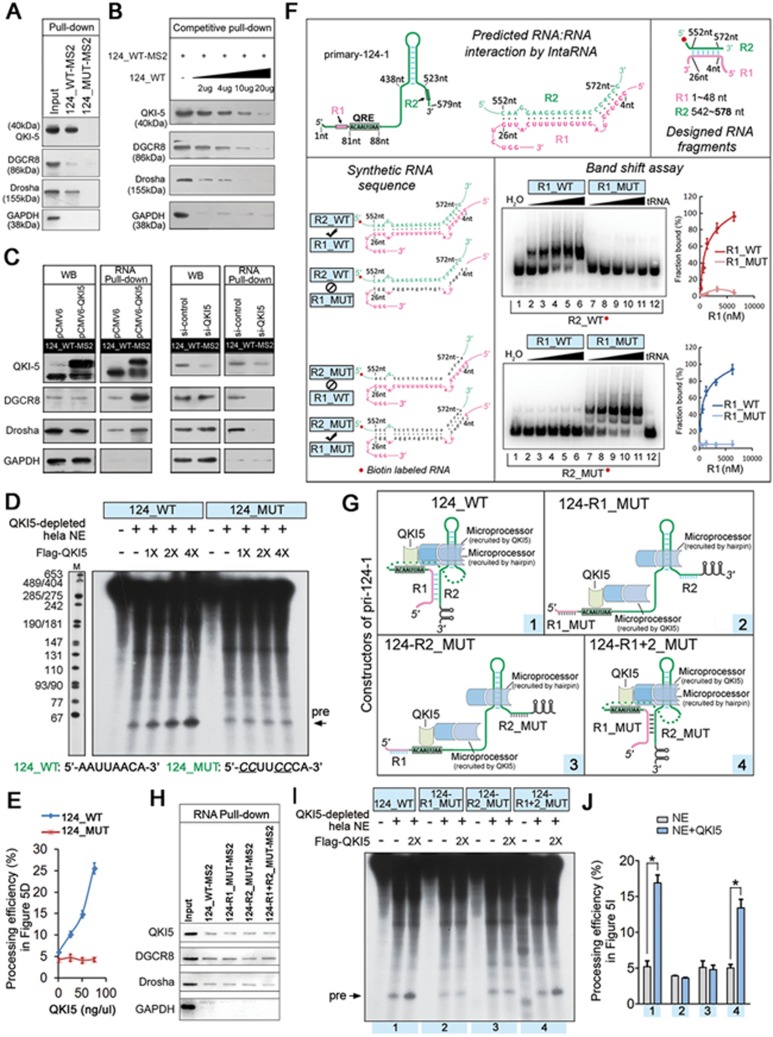
Figure 5.
Association of QKI5 with pri-124-1 promotes its processing by Microprocessor. (A) Immunoblot of endogenous QKI5, DGCR8 and Drosha in RNA pull-down assays from 293T cells transfected with either MS2-tagged 124_WT (124_WT-MS2) or MS2-tagged 124_MUT (124_MUT-MS2). The unrelated protein GAPDH was used as a control. The same sample as shown in Figure 3K was used in this analysis. (B) Immunoblot of endogenous QKI5, DGCR8 and Drosha in competitive RNA pull-down assays, as shown in Figure 3J. The same sample as shown in Figure 3L was used in this analysis. (C) Left WB panels: immunoblot of endogenous levels of QKI5 (or Flag-QKI5), DGCR8 and Drosha in 293T cells co-transfected with 124_WT-MS2 and either pCMV6-QKI5 or pCMV6, and si-QKI5 or si-control. Right RNA pull-down panels: immunoblot of endogenous QKI5, DGCR8 and Drosha associated with MS2-tagged 124_WT in RNA pull-down assays. (D) In vitro processing assay using [α-32P] UTP-labeled wild-type pri-124-1 (124_WT) or QRE mutant pri-124-1 (124_MUT) as the substrates. Pri-miRNA transcripts are incubated with QKI5-depleted HeLa NEs and various amounts of purified Flag-QKI5 as described in Materials and Methods. The sequences of wild-type and mutant QRE motifs are shown at the bottom of the figure, and altered sequences are indicated by an underline. (E) The quantitative data were derived from three independent in vitro processing experiments. The calculation formula was shown in Supplementary information, Figure S4B. (F) RNA-RNA interaction detected by band shift experiments. Upper panel: visualization of the predicted duplexes formed by 4-26 nt (included in the R1 region, 1-48 nt) and 552-572 nt (included in the R2 region, 542-580 nt) of pri-124-1 (for binding details, see Supplementary information, Figure S6C). Lower panel: band shift experiments with biotin-labeled wild-type R2 (R2_WT) or mutant R2 (R2_MUT) and increasing volumes of unlabeled wild-type R1 (R1_WT) or mutant R1 (R1_MUT, a complementary mutation to R2_MUT). The quantitative data were derived from 2-3 independent experiments. (G) A schematic representation of pri-124-1 variants that have wild-type or mutant R1 or/and R2 sequence. (H) The association of QKI5, DGCR8 and Drosha with different MS2-tagged pri-124-1 variants as described in G. (I) In vitro processing assay using [α-32P] UTP-labeled pri-124-1 variants as described in G. (J) The quantitative results of in vitro processing assay in I. The calculation formula was shown in Supplementary information, Figure S4B. Error bars reflect SEM from three biological replicates if not stated otherwise. Significance was determined by t-test with *P< 0.05.

