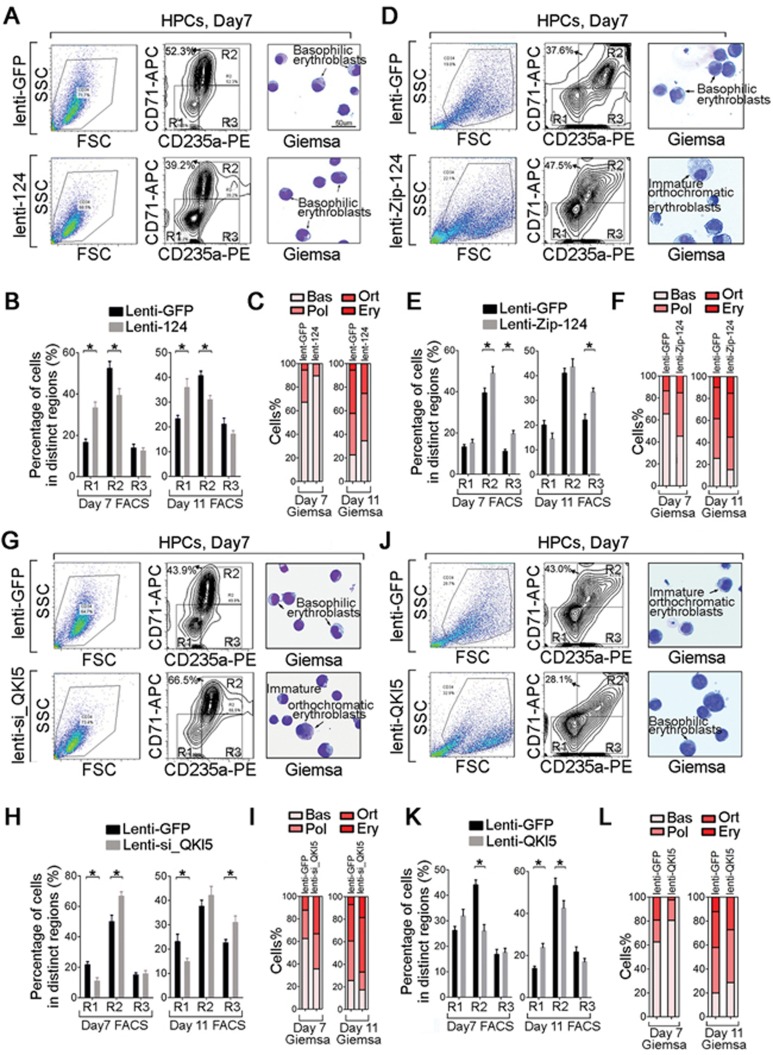
Figure 6.
miR-124 and QKI5 are negative regulators of erythroid differentiation. (A) Monitoring of the viable HPC population (left panel) and the CD235a-/CD71-stained fraction (medium panel) of lenti-GFP- or lenti-124-transduced HPCs on day 7 of E culture. The morphology (May-Grunwald Giemsa staining) of HPCs is shown in the right panel. A 400× magnification of a representative field is shown. Scale bar, 50 μm. (B) Quantification of the percentage of cells gated as CD71−/CD235a−, CD71high/CD235a+ and CD71low/CD235a+ fractions in HPCs transduced with lenti-GFP or lenti-124 on days 7 and 11 of E culture. (C) Quantification of the percentages of basophilic (Bas), polychromatophilic (Pol), orthochromatic (Ort) erythroblasts and erythrocytes (Ery) that were determined by Giemsa staining of cytospin preparations of lenti-GFP- or lenti-124-transduced HPCs on days 7 and 11 of E culture. (D) Monitoring of the viable HPC population (left panel) and the CD235a-/CD71-stained fraction (medium panel) of lenti-GFP- or lenti-Zip-124-transduced HPCs on day 7 of E culture. The morphology (May-Grunwald Giemsa staining) of HPCs is shown in the right panel. A 400× magnification of a representative field is shown. Scale bar, 50 μm. (E) Quantification of the percentage of cells gated as CD71−/CD235a−, CD71high/CD235a+ and CD71low/CD235a+ fractions in HPCs transduced with lenti-GFP or lenti-Zip-124 on days 7 and 11 of E culture. (F) Quantification of the percentages of basophilic (Bas), polychromatophilic (Pol), orthochromatic (Ort) erythroblasts and erythrocytes (Ery) that were determined by Giemsa staining of cytospin preparations of lenti-GFP- or lenti-Zip-124-transduced HPCs on days 7 and 11 of E culture. (G) Monitoring of the viable HPC population (left panel) and the CD235a-/CD71-stained fraction (medium panel) of lenti-GFP- or lenti-si_QKI5-transduced HPCs on day 7 of E culture. The morphology (May-Grunwald Giemsa staining) of HPCs is shown in the right panel. A 400× magnification of a representative field is shown. Scale bar, 50 μm. (H) Quantification of the percentage of cells gated as CD71−/CD235a−, CD71high/CD235a+ and CD71low/CD235a+ fractions in HPCs transduced with lenti-GFP or lenti-si_QKI5 on days 7 and 11 of E culture. (I) Quantification of the percentages of basophilic (Bas), polychromatophilic (Pol), orthochromatic (Ort) erythroblasts and erythrocytes (Ery) that were determined by Giemsa staining of cytospin preparations of lenti-GFP- or lenti-si_QKI5-transduced HPCs on days 7 and 11 of E culture. (J) Monitoring of the viable HPC population (left panel) and the CD235a-/CD71-stained fraction (medium panel) of lenti-GFP- or lenti-QKI5-transduced HPCs on day 7 of E culture. The morphology (May-Grunwald Giemsa staining) of HPCs is shown in the right panel. A 400× magnification of a representative field is shown. Scale bar, 50 μm. (K) Quantification of the percentage of cells gated as CD71−/CD235a−, CD71high/CD235a+ and CD71low/CD235a+ fractions in HPCs transduced with lenti-GFP or lenti-QKI5 on days 7 and 11 of E culture. (L) Quantification of the percentages of basophilic (Bas), polychromatophilic (Pol), orthochromatic (Ort) erythroblasts and erythrocytes (Ery) that were determined by Giemsa staining of cytospin preparations of lenti-GFP- or lenti-QKI5-transduced HPCs on days 7 and 11 of E culture. Error bars reflect SEM from three biological replicates if not stated otherwise. Significance was determined by t-test with *P< 0.05.

