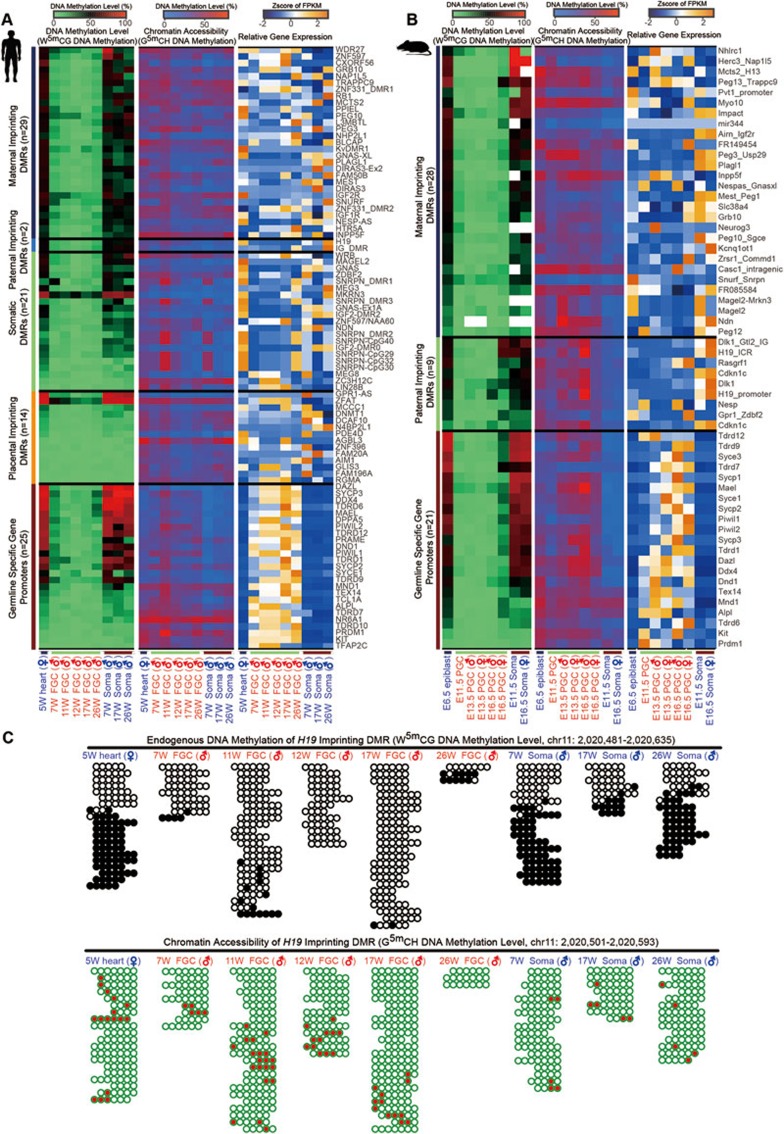
Figure 4.
Chromatin accessibility landscapes of imprinted genes and germline-specific genes. (A, B) Heatmaps showing endogenous DNA methylation (WCG DNA methylation level), chromatin accessibility of the promoter regions (GCH DNA methylation level) and relative gene expression (z-score of the FPKM values) of human (A) and mouse (B) imprinted genes and germline-specific genes. Notably, in the heatmaps, the endogenous DNA methylation levels of human and mouse imprinted genes were calculated based on the WCG DNA methylation levels of the imprinting DMRs, whereas the endogenous DNA methylation levels for the germline-specific genes were calculated based on the WCG DNA methylation levels of their promoter regions. (C) DNA methylation graphs showing endogenous DNA methylation dynamics (upper panel) and chromatin accessibility (bottom panel) of human H19 imprinted DMR across stages. In upper panel, white and open cycles indicate the unmethylated CpG sites in WCG context (endogenously unmethylated state), whereas the black and filled cycles indicate the methylated CpG sites in WCG context (endogenously methylated state). In the bottom panel, green and open cycles (the unmethylated GCH sites) indicate closed chromatin, whereas the red and filled cycles (the methylated GCH sites) indicate opened chromatin. Only the pair-ended reads with no less than four consecutive WCG or GCH trinucleotides covered are plotted.

