Figure 2.
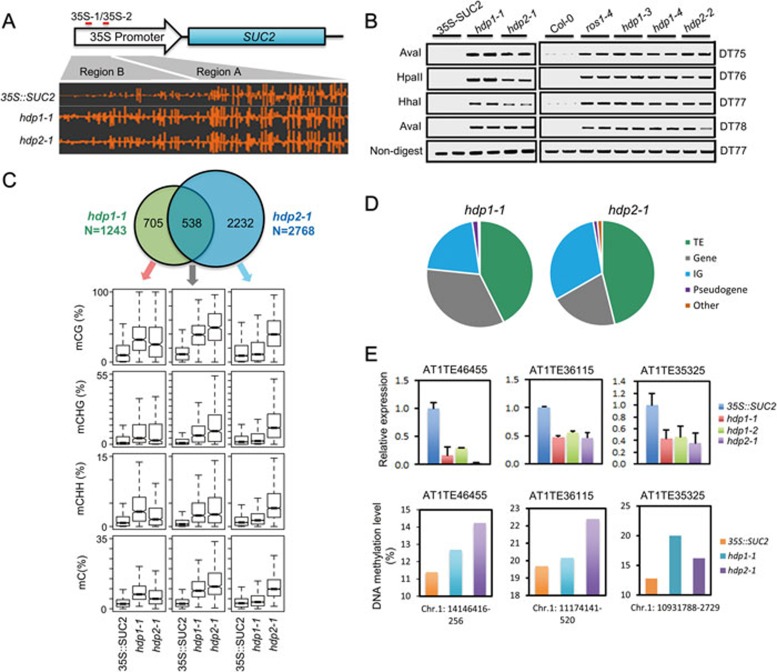
Dysfunctions of HDP1 and HDP2 alter DNA methylation and endogenous TE silencing. (A) A screenshot from Integrative Genome Browser showing DNA methylation status at the 35S::SUC2 transgene promoter region. Vertical bars on each track indicate DNA methylation levels. (B) Chop-PCR showing that hdp1 and hdp2 mutants displayed a hypermethylation phenotype in ROS1 DNA demethylation target loci13. Amplification of non-digested DNA served as a control. (C) Upper panel: Venn diagram showing the numbers of hyper-DMRs overlap between hdp1-1 and hdp2-1 mutants. Lower panel: Box plots displaying DNA methylation levels (CG, CHG, CHH and total C) calculated from the corresponding overlapping or unique hyper-DMRs. Increases of DNA methylation levels from any mutant compared to 35S::SUC2 wild type are statistically significant (Supplementary information, Table S1). (D) Hyper-DMRs annotation in hdp1-1 and hdp2-1 mutants. IG represents intergenic regions. (E) Selected endogenous TEs are repressed by hpd1 and hdp2 mutations. RT-qPCR results are means ± SD of three biological replicates. Relative expression was firstly normalized by the expression of ACTIN2 and then by the expression in 35S::SUC2 wild-type plants. Therefore the relative expression of TE in 35S::SUC2 wild-type plants was defined as 1.0. The DNA methylation levels at corresponding TE regions were calculated from WGBS data. See also Supplementary information, Figure S2 and Table S1.

