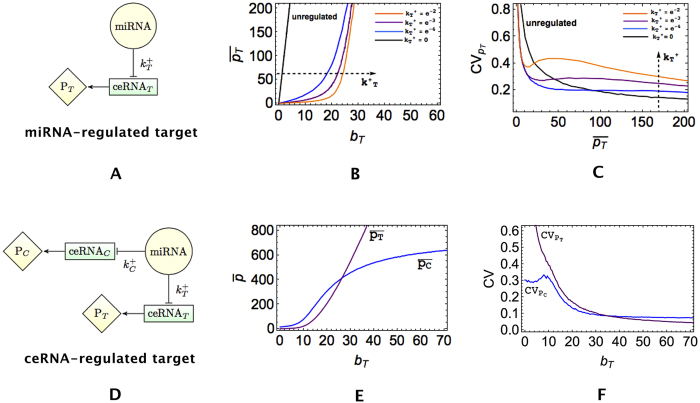
Figure 2. Dependence of mean protein expression levels and relative fluctuations (CV) on the transcription rate bT of the target.
Panels (B) and (C) describe the case of a simple miRNA-regulated target, shown in panel (A). In (B),  increases in the direction of the arrow (specifically,
  for orange, purple, blue, black curves respectively). Panels (E) and (F) describe the case of a target regulated through ceRNA competition, depicted in (D), for
  and
and  . Note that no PPI is considered in this case.

