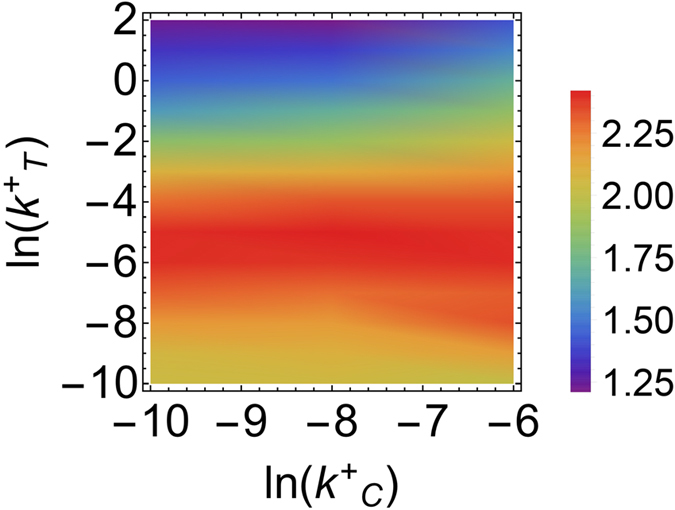
Figure 6. Capacity of the protein complex synthesis channel, Imax(Cp, bT), as a function of the miRNA-ceRNA binding strengths of the target ( ) and the competitor (
 ).
).

To allow for comparisons, simulations were performed at fixed output variation range  (with
(with  ) and variable bT.
