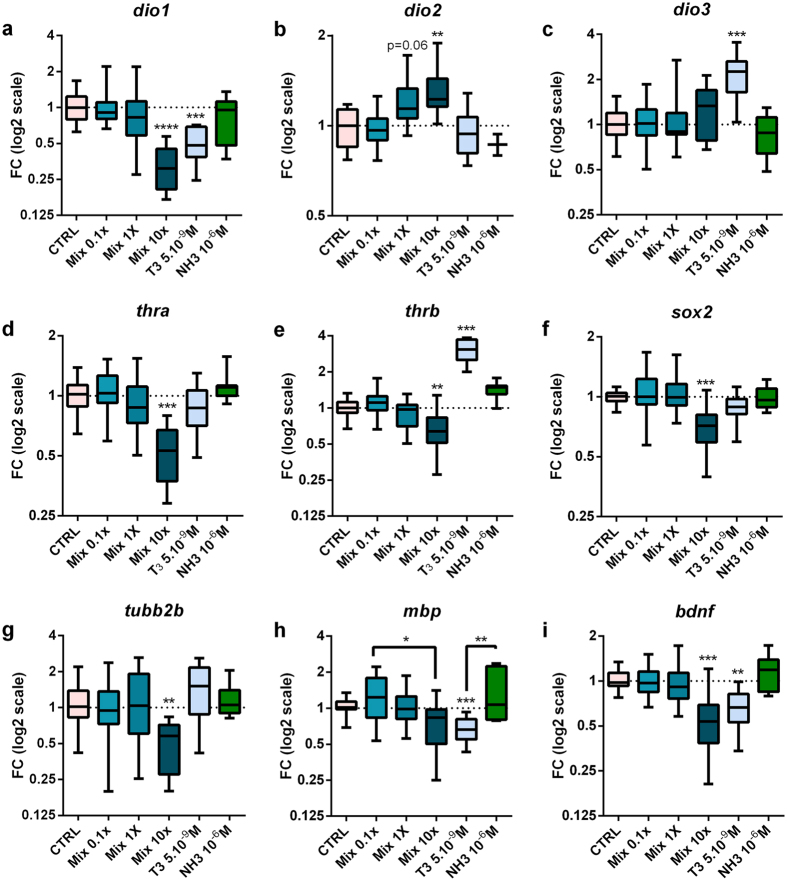
Figure 3. Mixture exposure modifies thyroid hormone and neuronal development related gene expression in brain.
Wild type NF45 X. laevis tadpoles were exposed to mixture for 72 h in the absence of T3. For each concentration tested between 7 to 12 pools of three brains were used from at least four independent experiments. Total brain mRNA transcripts levels were quantified using RT-qPCR: (a), dio1 (b), dio2 (c), dio3 (d), thra (e), thrb (f), sox2 (g), tubb2b (h), mbp (i), bdnf. Relative fold changes were calculated using geometric mean of ef1a and odc as normalizers. Results are presented as fold changes using a log2 scale and DMSO-treated animals (CTRL) values for the 1.0 reference. Statistics were done on dCts and used Kruskal-Wallis tests (Box plots median and quartiles), *p < 0.05, **p < 0.01, ***p < 0.001, ****p < 0.0001.

