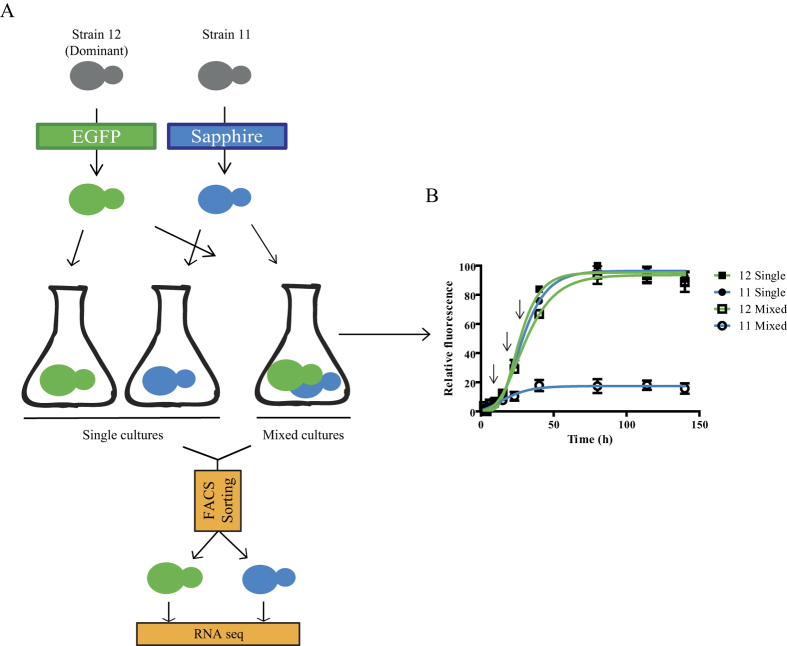
Figure 1. Transcriptomics of the complex dominance phenomenon in yeast.
(A) A schematic representation of the steps that were followed to determine changes in the transcriptome of cells in single or mixed cultures. (B) Evaluation of the yeast growth of fluorescently labelled dominant (12) and non-dominant (11) strains in single or mixed cultures in microtiter plates. The average value of the biological triplicates and standard deviation are shown.

