
Figure 3. SO2 production and resistance in dominant and non-dominant strains.
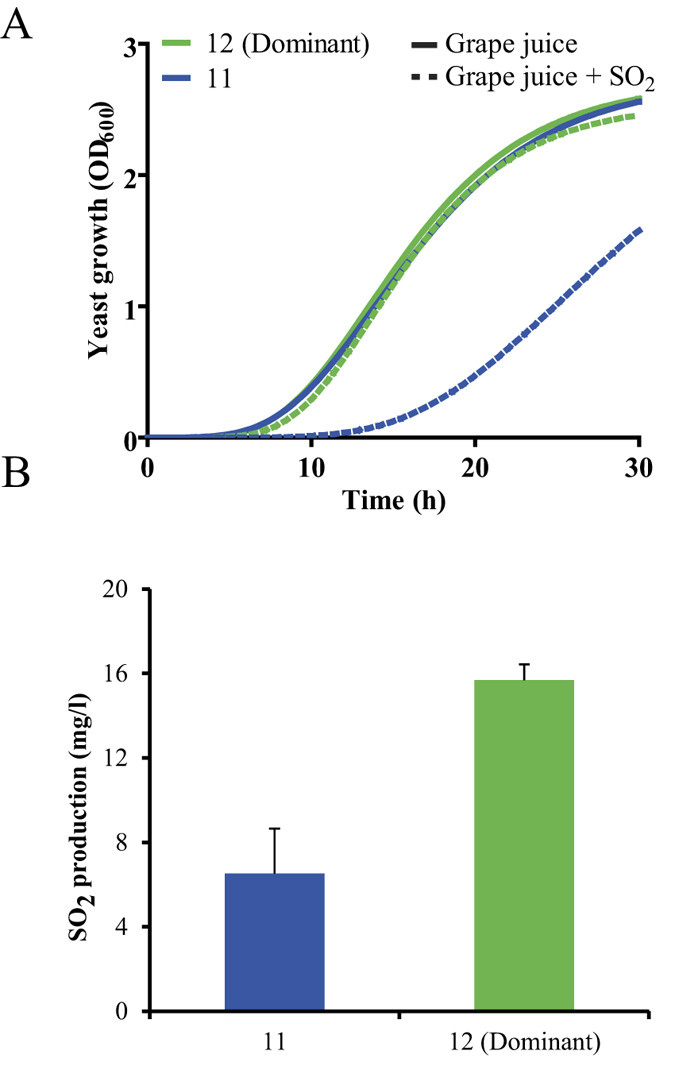
(A) Strains, pre-grown in YPD with geneticin, were inoculated into grape juice with (dotted lines) or without 60 mg/l SO2 (continuous lines) to evaluate the SO2 resistance, and growth was monitored spectrophotometrically according to the time. The average value of the biological triplicates is shown, and the standard deviation was below 10%. Strains containing empty plasmid were used as a control. (B) SO2 production, after grape juice fermentation, was measured in the dominant and non-dominant strains. The average values of the biological triplicates and the standard deviation are shown. The differences between the two strains were statistically significant (p < 0.05, Fisher exact test).