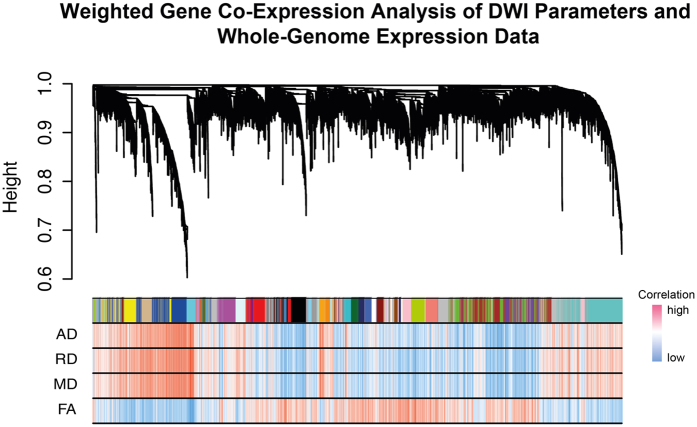
Figure 2. Visualisation of the Weighted Gene Co-Expression Network Analysis.
Below the cluster branches, a module bar marks different modules by their specific colours. The correlation heatmap below, indicates the correlation between DWI parameters and respective gene expression. Strong correlation was coloured in red, low correlation in blue.

