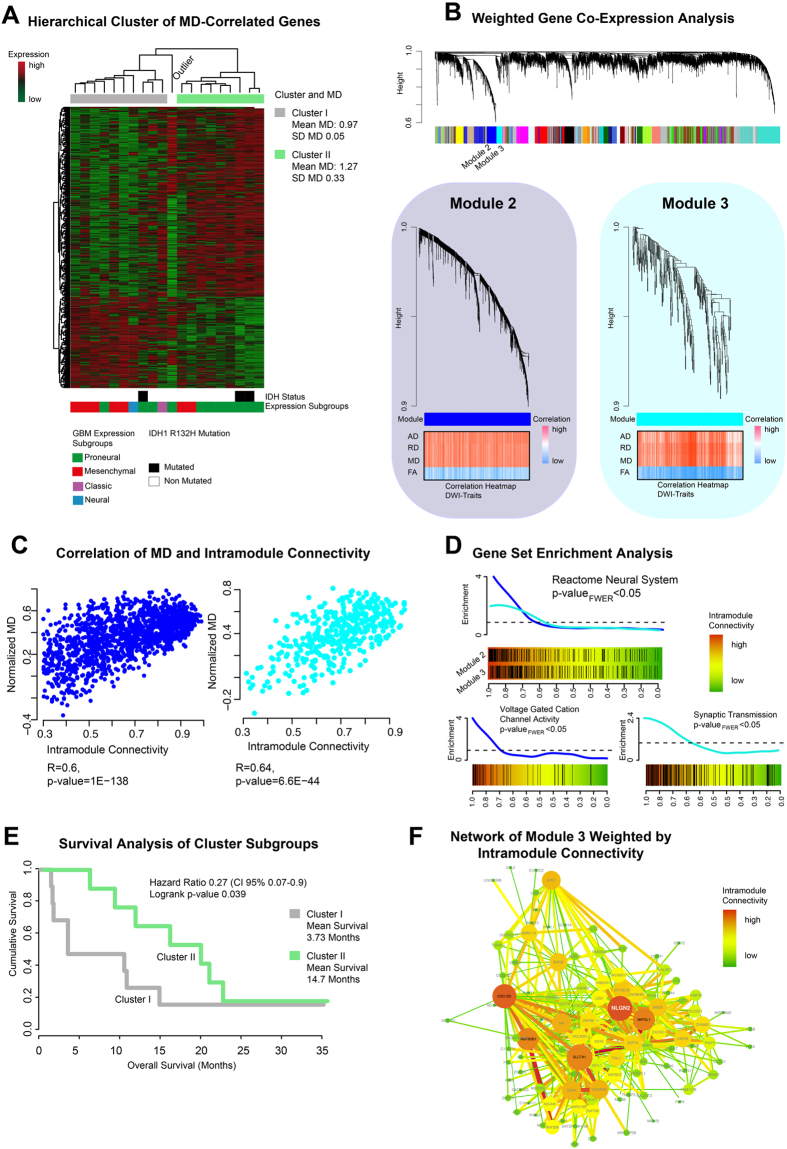
Figure 3.
(A) Mean diffusivity (MD) associated genes are clustered by Spearman’s rank correlation into two clusters. Bars below the heatmap describe IDH1-status and expression subgroup of each patient. (B) Weighted Gene Co-Expression Network Analysis of the whole transcriptomic data. In the bottom panel the detailed branches of module 2 and 3 are presented. Correlation heatmaps of MD and module contained genes are given in the bottom panel. (C) Scatterplots of intramodule connectivity (KME) confirmed the strong correlation of MD and module 2 and 3. (D) Gene Set Enrichment Analysis of module 2 identified voltage-gated channel activation (bottom left panel), module 3 was associated with synaptic transmission (bottom right panel). (E) Survival analysis of patients of cluster I and cluster II (derived from A) shows a significantly different OS with a more favourable outcome for the cluster with the higher MD (mean 1.27 ± 0.33) versus the cluster with the lower MD (mean 0.97 ± 0.05), p = 0.039. (F) Network analysis of module 3 (derived from (B)). Size and colours indicate the intensity of intramodule connectivity.

