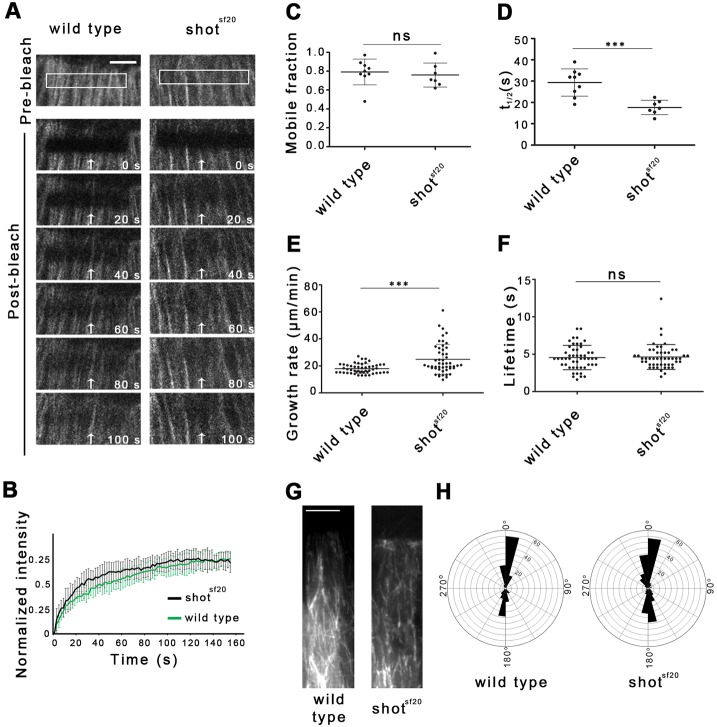
Fig. 4.
Shot stabilizes dynamic MTs of DME cells by regulating their dynamic properties. (A) Movies showing recovery of Tubulin–EGFP fluorescence in wild-type and shotsf20 mutant DME cells in a representative FRAP experiment. White boxes and white arrows indicate photobleached regions. Scale bar: 5 µm. (B) FRAP recovery curves show the relative GFP fluorescence intensities within the photobleached regions in wild-type (black, n=9) and shotsf20 mutant (gray, n=7) DME cells. (C,D) Scatter dot plots of fluorescence recovery halftimes (t1/2) and mobile fractions of Tubulin–EGFP measured in wild-type and shotsf20 mutants. In shotsf20 mutants, t1/2 was increased, whereas the mobile fraction of Tubulin–EGFP was unaffected. (E,F) Scatter dot plots of MT growth rate and lifetime of EB1 comets in wild-type (n=56 comets in two cells from two embryos) and shotsf20 mutant (55 comets in two cells from two embryos) DME cells expressing EB1–EGFP. Displacement of EB1–EGFP comets was faster in shotsf20 mutants than in wild-type DME cells, whereas the life-time of comets was unaffected. In C–F, results are mean±s.d. ***P<0.001; ns, not significant (t-test). (G) Projections of ten consecutive time frames of a movie showing EB1–EGFP tracks in wild-type and shotsf20 mutant DME cells. The projected time-lapse spans 11 s. (H) Windrose plots of MT growth tracks in wild-type (n=181 in four cells from two embryos) and shotsf20 mutant DME cells (n=269 in four cells from two embryos) expressing EB1–EGFP.

