Fig. 3.
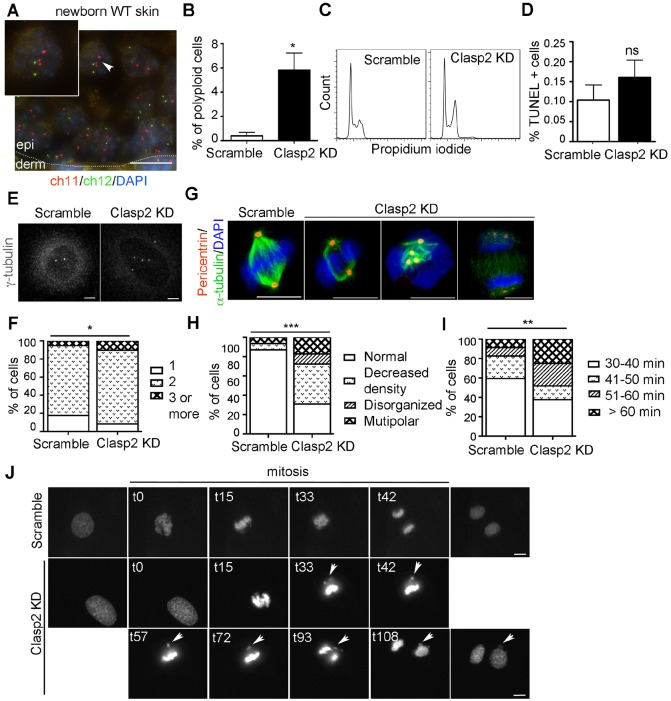
Mitotic defects upon loss of Clasp2 in non-transformed mouse keratinocytes. (A) FISH analysis for chromosomes (ch)11 and 12. Arrowhead indicates a suprabasal polyploid cell. Scale bar: 10 μm. (B) Percentage of polyploid mouse keratinocytes. (C) Scramble and Clasp2KD mouse keratinocytes cell cycle profiles. (D) Percentage of apoptotic cells (n=20 images per condition). (E) Staining of γ-tubulin in scramble and Clasp2KD mouse keratinocytes. Scale bars: 5 μm. (F) Quantification of centrosome number (n=193 scramble and 107 Clasp2KD cells). (G) Dividing scramble and Clasp2KD mouse keratinocytes were stained for pericentrin and α-tubulin. Scale bars: 10 μm. (H,I) Quantification of cells with the indicated spindle morphologies and the time spent in mitosis from cell rounding to completion of cytokinesis (n=68 scramble and 56 Clasp2KD cells). (J) Time-lapse images of H2B–GFP-expressing scramble and Clasp2KD mouse keratinocytes. The time after the initiation of DNA condesation is indicated. Arrowheads indicate lagging chromosomes. Scale bars: 10 μm. Data are presented as mean±s.e.m. (B,D). *P<0.04, **P<0.004, ***P=0.0001, ****P<0.0001; ns, non-significant; (B) two-tailed Student's t-test, (D) Mann–Whitney U test, (F, H, I) Fisher's exact test;. n=2 independent experiments per panel.

