Figure 2.

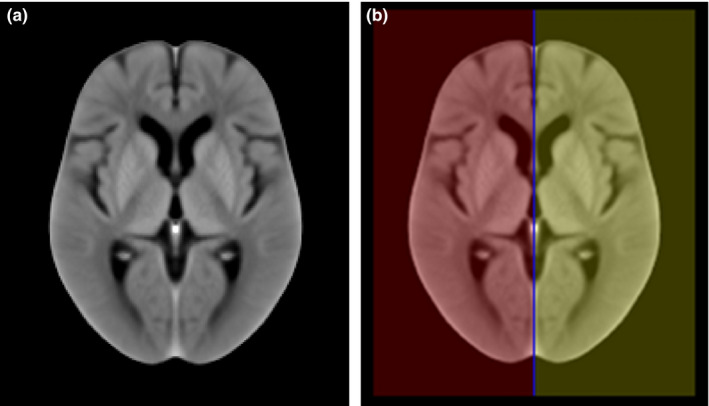
(a) The average symmetric in‐house ncCT template representing a healthy elderly population. (b) The binary mask of individual hemispheres (red and yellow) and longitudinal interhemispheric fissure (LIF, blue). [Color figure can be viewed at wileyonlinelibrary.com]
