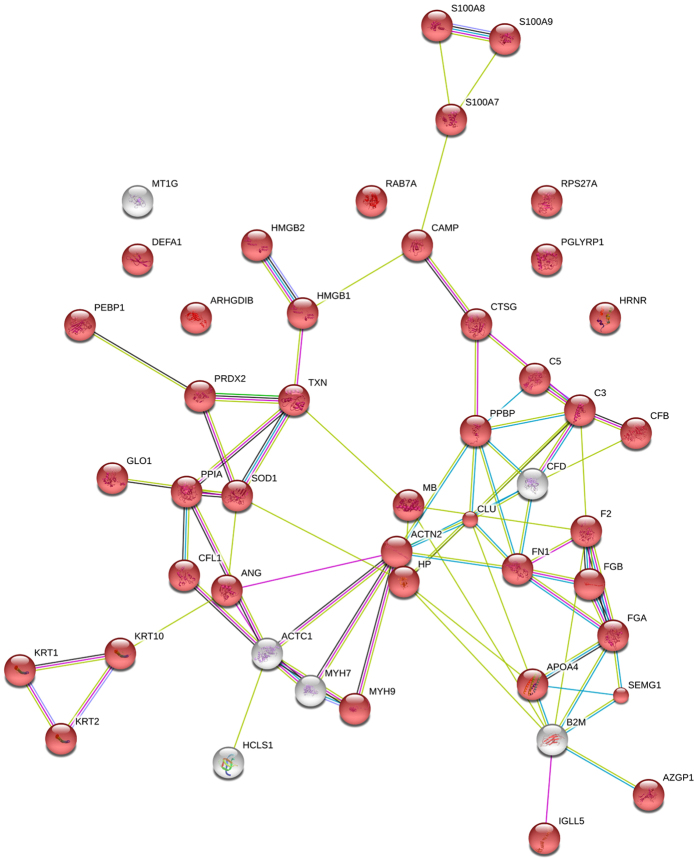
Figure 3. STRING Bioinformatic analysis of the proteins involved in immune system response shown in Table 4.
Colored network nodes represent query proteins. Edges represent protein-protein interactions and include different type of actions depicted by the colored lines. For known interactions: pink, experimentally determined; turquoise, from curated databases. For predicted interactions: green, gene neighborhood; blue, gene co-occurrence. For others interactions: olive green, textmining; black, co-expression; purple, protein homology. Extracellular proteins are marked with red color.

