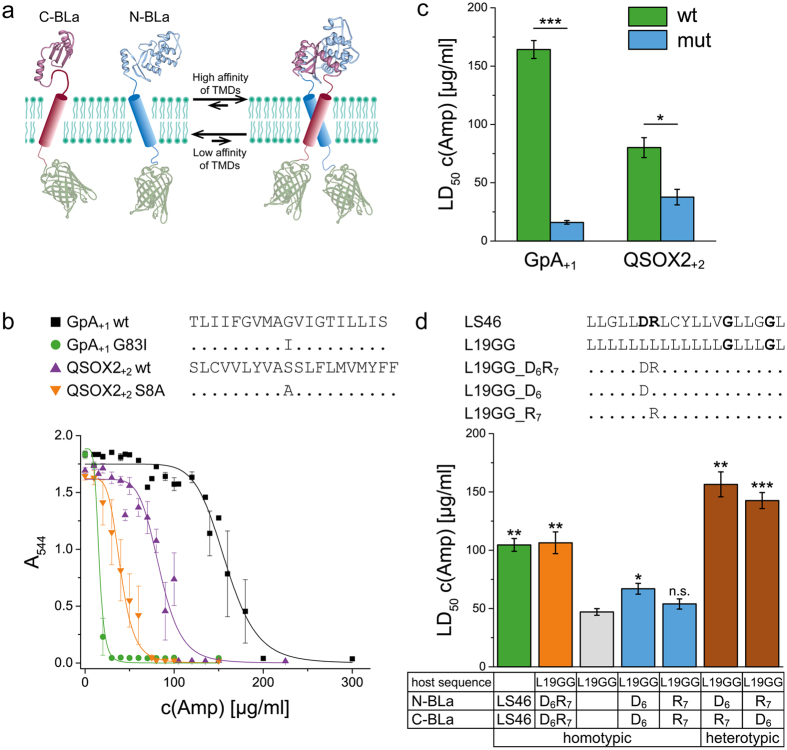
Figure 1. Design and validation of the BLaTM assay.
(a) Scheme depicting the main features of the system. (b) Example of dose-response curves where the decrease of E. coli cell density (A544) to increasing ampicillin concentration is used to calculate LD50 values. (c) LD50 values derived from part. (b) These values characterize the homotypic interaction of the wild-type (wt) GpA and QSOX2 TMDs and the impact of point mutations (mut). TMDs were inserted into the hybrid proteins at orientations where wild-type/mutant LD50 ratios were maximal (see: Supplementary Fig. S4). (d) Sequence-specific homo- and heterotypic interaction driven by ionizable residues. The LS46 orientation used here leads to superior LD50 values compared to other orientations (not shown). All data were generated using BLaTM 1.1 in E. coli BL21 (b,c) or in E. coli JM83 cells (d) and represent means ± SEM, n = 4 separate transformations. The denomination D6R7 corresponds to D5R6 previously used32. Single, double, or triple asterisks denote statistical significance at the 0.05, 0.01, or 0.001 confidence levels (relative to the mutants in part (c) or to L19GG in (d)).

