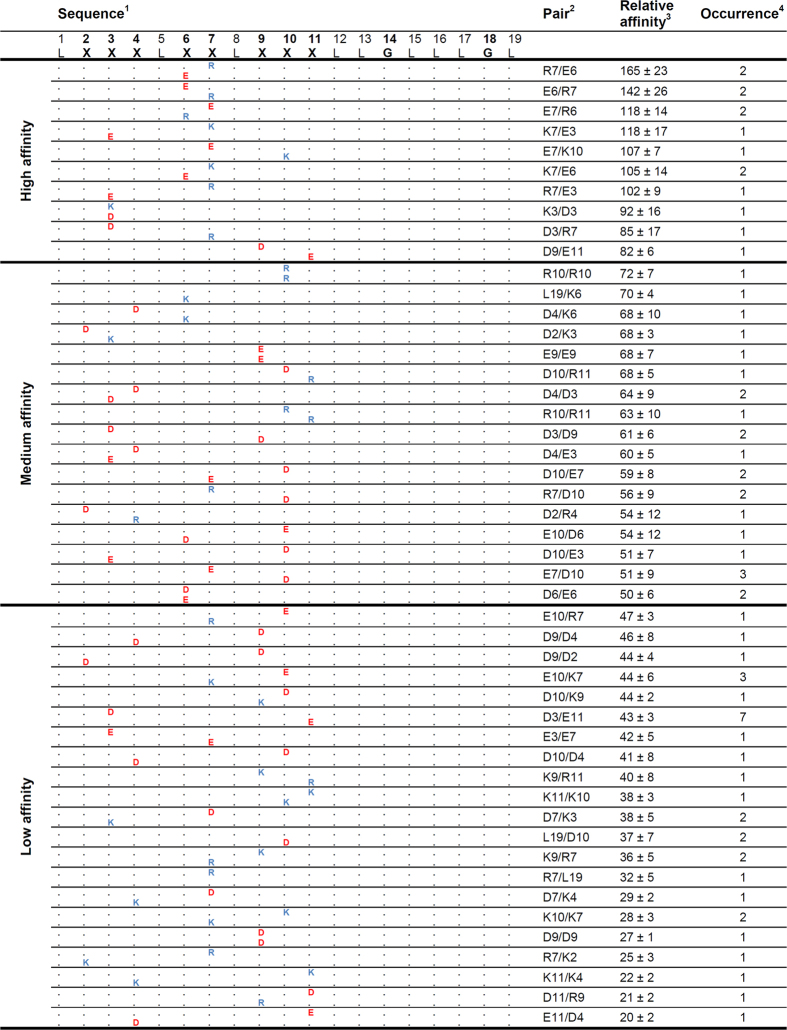
Figure 3. List of isolated TMD pairs sorted by affinity.
1The sequence above the identified sequence pairs represents the randomized model based on L19GG (X = R, K, E, or D). Dots in the identified sequences represent Leu. 2Single letter code of isolated N-BLa (upper sequence)/C-BLa (lower sequence) combination. 3In % (GpA+1 wt = 100%; GpA+1 G83I = 29 ± 3%; L19GG = 37 ± 4%); means ± SEM, n = 4–12. 4Number of times the sequence pair was found in the selected TMDs.

