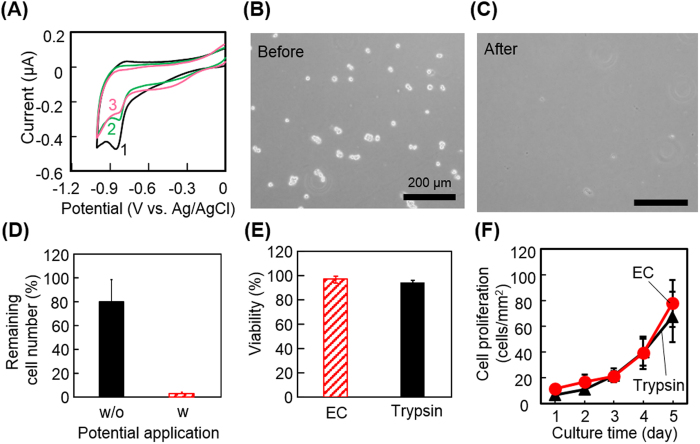
Figure 4. Characterizations of electrochemical cell detachment.
(A) Cyclic voltammograms during reductive desorption of the peptide-aptamer layer. The digits 1, 2, and 3 indicate the scan numbers. The scanning rate was 20 mV/s. (B,C) Phase-contrast images of Hep G2 cells on a gold surface before and after the application of −1.0 V with respect to Ag/AgCl. (D) Quantitative analysis of the electrochemical cell detachment. The number of cells was counted after conducting entire procedures for the detachment with (w, striped column) and without (w/o, solid column) the potential application. (E) Viability of cells detached by electrochemical potential application (EC, striped column) or by treatment using trypsin (solid column). (F) Proliferation of electrochemically detached cells. Cells were detached by electrochemical potential application (EC, closed circle) or by treatment using trypsin (closed triangle) and re-seeded in a conventional culture dish. Changes in the number of cells were counted. (D–F) The values and error bars represent means and standard deviations calculated from three independent experiments.

